Download
1 / 106
1.2k likes | 1.54k Vues
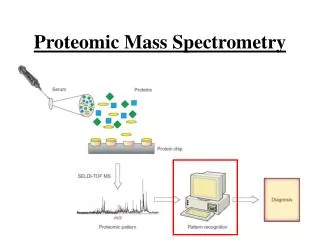
Proteomic Analyses by Mass Spectrometry . Iris Finkemeier MPI Plant Breeding Research 14 January 2014 finkemeier@mpipz.mpg.de. This talk. Concepts of MS- based proteomics The three main applications : D escription & identification Quantitation Interaction.

E N D
Proteomic Analyses by Mass Spectrometry Iris Finkemeier MPI Plant Breeding Research 14 January 2014 finkemeier@mpipz.mpg.de
This talk • Conceptsof MS-basedproteomics • The threemainapplications: • Description & identification • Quantitation • Interaction
TRANSCRIPTOME PROTEOME Gene Transcript Protein Translation Transcription Genes to proteins (mRNA)
“The proteome is the entire set of proteins expressed by a genome, cell, tissue or organism at a certain time.”
Proteomics “The goal of proteomics is a comprehensive, quantitative description of protein expression and its changes under the influence of biological perturbations such as disease or drug treatment.” From: N. Leigh Anderson and Norman G. Anderson: „Proteome and proteomics: New technologies, newconcepts, and newwords“, ELECTROPHORESIS 19, 1853 – 1861 (1998)
Lack of correlation between transcript and protein Fd-GOGAT AGPase
Proteomicsatthe „sweetspot“ e.g. 20,000 genes Spliceforms (~ 5x increasedcomplexity) Post-translationalmodifications (> 200 PTMs known, 10x increasedcomplexity) Hoog & Mann, AnnuRev Genom Human Genet (2004)
Howcomplexiscomplex? • Human genome: 20.300 predicted protein coding genes • 230 cell types, body fluids • Spliceforms • Post-translational processing and modifications • Interactions and protein complexes • Human proteome project (launched 2011)!
Protein coverage & technologicalinnovation Bärenfaller et al., Nature (2008) Arabidopsisproteome > 13.000 proteinsidentified Mascot Synapt LTQ-FT Shotgunproteomics Orbitrap Ahrens et al., NatRev Mol CellBiol (2010)
COOH H C R NH2 α-Amino acids The 20 amino acids specified by the genetic code have the general formula: The size, polarity and hydrogen bonding properties of the side chain (R) attached to the α-carbon atom confer unique properties on each amino acid. L-alanine
Aliphatic non-polar side chains The amino acids in this group have side chains with no affinity for water. These amino acids tend to be found in the hydrophobic core of water soluble proteins, or in contact with lipids in membrane proteins.
Uncharged polar side chains The electronegative oxygen atom confers a degree of polarity on the side chains of asparagine, glutamine, serine and threonine, allowing the formation of hydrogen bonds. The sulphur atom is only weakly electronegative and the cysteine side chain does not form hydrogen bonds. These amino acids will often be found on the surface of a soluble protein, but their weak polarity means that they can also be easily stabilised in the interior of a folded protein.
Charged polar side chains Some side chains ionise at normal physiological pH values. + Amino acids with charged side chains are often found on the surfaces of soluble proteins. H Charged side chains only occur in hydrophobic regions if they can form an ion pair with an oppositely charged side chain.
Aromatic side chains The aromatic side chains are predominantly non-polar, but the –OH group in tyrosine and the NH group in tryptophan allow these side chains to form H-bonds. Phenylalanine has the most non-polar side chain of all the amino acids and hence the strongest preference for a non-aqueous environment. This preference can be quantified and it decreases in the order: Phe > Met > Ile > Leu > Val > Cys > Trp > Ala > Thr > Gly > Ser > Pro > Tyr > His > Gln > Asn > Glu > Lys > Asp > Arg.
O Cα → + O O C N Φ H NH2 CH C OH NH2 CH C OH Cα H Ψ R2 R1 O O NH2 CH C N CH C OH R1 R2 The peptide bond Condensation of two amino acids results in a peptide bond: The condensation process is energy consuming (~160 kJ mol-1) and it can be repeated many times to produce polypeptides containing hundreds of amino acids. The peptide bond has partial double bond character, preventing free rotation about the carbon-nitrogen axis:
2-D gel electrophoresis pI 3 4 5 6 7 8 9 10 Up to 1000 proteins can be reproducibly resolvedon a single gel 94 66 43 kDa 30 20 14
+ - 2D gel electrophoresis 1. Isoelectric focusing Alkaline pH COOH COO- + H+ NH3+ NH2 + H+ Acidic pH pH gradient 3 10 Cathode (-) Anode (+)
- - - 2D gel electrophoresis 2. SDS-polyacrylamide gel electrophoresis Cathode (-) polyacrylamide gel Anode (+)
Separation by charge 1st Dimension (IEF) 2nd Dimension SDS-PAGE Separation by size
analysis of 2D-gels • 3 replicate gels for the control and each treatment were run • Gels were imaged using a CCD-based imaging system • Images were analysed using PDQuest software. 3. Data Analysis 2. Spot matching 1. Spot detection& quantitation Statistical tests t-test Mann-Witney signed rank test Wilcoxon paired sample test Partial least squares test
Blue native PAGE of mitochondrial respiratory complexes 1-Dimension
Workflow Cell fractionation Membrane isolation Solubilization of protein complexes BN-PAGE Denaturation of protein complexes SDS-PAGE
Detergents gal glu xyl Digitonin Dodecyl-ß-D-maltoside
4.5-9 mM ß-DM or 9-18 mM Digitonin Effect of detergent concentration on membrane solubilization Decreasing molecular mass of protein complexes 1.1 mM ß-DM or 4.5 mM Digitonin Increasing concentration of detergent micelles
Blue native PAGE of mitochondrial respiratory complexes 1-Dimension
Fluorescence Coomassie Silver Comparison of different staining methods after BN/SDS-PAGE : one gel, three stains
Cy2 Cy3 Cy5 CyDye labeling of membrane protein complexes Ex Em 488 nm 532 nm 633 nm
BN-PAGE BN-PAGE SDS-PAGE SDS-PAGE BN-PAGE condition I condition II SDS-PAGE condition I versuscondition II 2D BN/SDS-DIGE of plastid membrane complexes + =
Gel-based vs. gel-freeproteomics 1D / 2D gel digest Spot excision Immunodetection LC-MS/MS αAOX N-terminal sequencing, massspectrometry Database search (genome!!!) Ponceau S Protein ID Protein ID
Gel-based vs. gel-freeproteomics 1D / 2D gel digest 1 sample 1 gel > 1000 protein IDs per sample 1 sample per spot/protein ID Spot excision Immunodetection LC-MS/MS 1 blot 1 protein ID αAOX N-terminal sequencing, massspectrometry Database search Ponceau S 1000 hybrid., 1000 antibodies! 1000 samples! Protein ID Protein ID
Identification of proteins by mass spectrometry analysis Bottom-up proteomics (Top-down proteomics)
A veryshort LC-MS/MS introduction Liquid chromatography (LC) Tandem massspectrometry (MS/MS) digest
Coupling of HPLC and MS HPLC (separation/UV detection) Sample MS TIC = total ion count
Basic Components of a Mass Spectrometer ion source mass analyzer detector generate ions ion separation ion analysis ESI MALDI Quadrupol Iontraps TOF (Time of Flight) Usedfor Peptides and Proteins
What LC-MS/MS does ECCHGDIIECADDR ECCHGDIIECADDR ECCH GDIIECADDR CADDR ECCHGDIIE MS1 MS2 fragmentation measure masses
Predicting tryptic-fragment masses 1. Identify genes Genomic DNA 2. Translate 3. Predict trypsin cleavage sites 4. Calculate theoretical masses of tryptic fragments Identifying Proteins by peptide mass fingerprinting (PMF) 813.432 825.501 869.482 890.975 969.544 1025.567 1069.554 1082.042 1113.565 1141.596 2249.082 813.432 825.501 869.482 890.975 969.544 1025.567 1069.554 1082.042 1113.565 1141.596 2249.082 OBSERVED THEORETICAL
Trypsin cleavage site prediction (web.expasy.org/peptide cutter)
How can Peptides and Proteins Be Ionized? Elektrospray-Ionisation (ESI) John B. Fenn Matrix-Assisted Laser Desorption/Ionization (MALDI) • Koichi Tanaka • Franz Hillenkamp • Michael Karas