Download
1 / 23
280 likes | 623 Vues
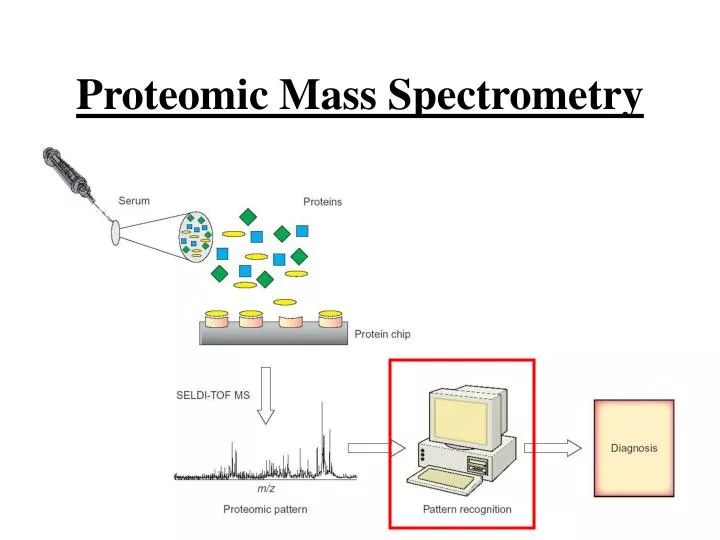
Proteomic Mass Spectrometry. Outline. Previous Research Project Goals Data and Algorithms Experimental Results Conclusions To Do List. Motivation. MS spectra has high dimension Most ML algorithms are incapable of handling such high dimensional data Dimensionality Reduction (DR)

E N D
Outline • Previous Research • Project Goals • Data and Algorithms • Experimental Results • Conclusions • To Do List
Motivation • MS spectra has high dimension • Most ML algorithms are incapable of handling such high dimensional data • Dimensionality Reduction (DR) • Preserve as much information as possible, while reducing the dimensionality. • Feature Extraction (FE) • Removal of irrelevant and/or redundant features (information)
Previous research • Usually applies DR then FE • Does Order matter ? DR: Down Sampling, PCA, Wavelets FE: T-Test, Random Forests, Manual Peak Extraction • In [conrads03] show that high resolution MS spectra produces better classification accuracy. • Most previous research down samples spectra CONJECTURE: Down Sampling detrimental to performance.
Project Goals • Test Down Sampling Conjecture • Compare FE algorithms (NOTE: Optimal FE is NP-hard !) • Use a simple but fast classifier to test a number of FE approaches • Test across different data sets • Are there any clearly superior FE algorithms ?
Three Data Sets Heart/Kidney (100/100) • 164,168 features, 2 classes Ovarian Cancer (91/162) • 15,154 features, 2 classes Prostate Cancer (63/190/26/43) • 15,154 features, 4 classes • Normal, Benign, Stage 1, Stage 2 Cancer • Transformed into Normal/Benign Vs Cancer (1&2)
Algorithms Centroid Classifier • given class means P, Q and sample point s C = argmin (d(P,s), d(Q,s)) P Q d(Q,s) d(P,s)
Algorithms • T-test – do the means of 2 distr. Differ ? • KS-test – do the cdf differ ? • Composite – (T-test)*(KS-test) • IFE - Individual Feature Evaluation using the centroid classifier • DPCA – discriminative principle component analysis
Preliminary Experiments • Compare normalization approaches • Compare similarity metrics • Cross correlation • (-L1) • Angular • Across 3 data sets => 27 configurations
Preliminary Experiments (cont) • No single norm/metric clearly superior on all data sets • 2-5% increase in performance if suitable normalization and similarity metric chosen (can be up to 10% increase) • L1-norm with angle similarity metric worked well on Heart/Kidney and Ovarian Cancer sets (easy sets) • L1-norm and L1-metric best on Prostate 2-class problem (hard set).
Statistical Tests • T-test, KS-test, Composite • Ranks features in terms of relevance • SFS – Sequential Forward Selection • Selects ever increasing feature sets • I.e., {1}; {1,2}; {1,2,3}; {1,2,3,4}
Single Feature Classification • Use each feature to classify test samples • Rank features in terms of performance • SFS
Summary • For each data set, for each FE algorithm ran 15,000 3-fold cross validation experiments. • Total of 810,000 FE experiments ran • DE experiments ~ 100,000 experiments • Additional 50,000 experiments using DPCA classifier • did not produce significantly different results than the centroid classifier
Conclusions • HK and Ovarian Data sets considerably easier to classify than Prostate Cancer • Feature Extraction (in general) significantly improves performance on all data sets • No single technique superior on all data sets. • Best Performance using SFS with feature weighting • Smallest feature set with T-test of KS-Test • Composite test inferior to all others. • Down Sampling appears to be detrimental • What about other Dim. Red. Techniques ? • E.g. PCA and Wavelets
Conclusions • Down Sampling appears to be detrimental • What about other Dim. Red. Techniques ? • E.g. PCA and Wavelets • What about FE after Down Sampling ? • On Prostate data performance appears to drop w.r.t. to best single feature.
To Do List • Check PCA, Wavelets and other DR techniques • Use other (better) classifiers • General Hypothesis • Use a simple fast classifier together with FE techniques to extract a good feature set • Replace classifier with a more effective one. • Need to verify that other classifiers respond well to the extracted features.