Download
1 / 32
500 likes | 970 Vues
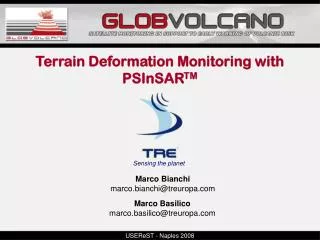
Terrain Deformation Monitoring with PSInSAR TM. Sensing the planet. Marco Bianchi marco.bianchi@treuropa.com. Marco Basilico marco.basilico@treuropa.com. PS. PS. R 1. PS. R 2. By using: temporal series of SAR data identification of: coherent radar targets:

E N D
Terrain Deformation Monitoring with PSInSARTM Sensing the planet Marco Bianchi marco.bianchi@treuropa.com Marco Basilico marco.basilico@treuropa.com
PS PS R1 PS R2 • By using: • temporal series of SAR data • identification of: • coherent radar targets: • the Permanent Scatterers (PS) where atmospheric effects can be estimated and removed The PS TechniqueTM ΔR PS
Madagascar LA REUNION Piton de la Fournaise(Isle de la Reunion) Piton de la Fournaise
Piton SAR Datasets 4 datasets processed: 33 scenes Envisat S2 Ascending track 84 39 scenes Envisat S2 Descending track 363 32 scenes Envisat S4 Ascending track 127 27 scenes Envisat S4 Descending track 320
Ascending Datasets Multi-Image Reflectivity azimuth range S2 S4
Foreshortening Foreshortening Descending Datasets, some interferograms S2 Descending T363 Multi-Image Reflectivity S2 Descending: 20031011-20031115 Bn=-303 [m]; Bt=35 [days] S2 Descending: 20040403-20040717 Bn=105 [m]; Bt=-167 [days] S4 Descending T320 Multi-Image Reflectivity S4 Descending: 20040331-20040714 Bn=342 [m]; Bt=-105 [days] S4 Descending: 20051221-20060125Bn=1.8 [m]; Bt=35 [days]
Descending Datasets, considerations • Most of the interferograms computed starting from descending-mode acquisitions don’t show a coherent signal • Just a few inteferograms show coherent signal (see previous examples) where fringes are visible at least over some portions of the volcanic camera • Even in case of coherent signal and small normal baseline (see previous examples), strong foreshortening effects prevent from the use of such interferometric pairs for time series displacement estimation. • Coherent parts of the volcano resulting from the analysis of descending data don’t overlap with results gathered from ascending data • Descending data will be temporarily discarded • The analysis of ad-hoc permanent scatterers over Piton will be performed with S2 and S4 ascending data only
Differential Interferograms: examples S2 Ascending T84 Master: 20031130; Slave: 20030921 Bt=70 [days] Bn=29 [m] π wrapped wrapped wrapped -π 15 unwrapped unwrapped unwrapped radians -74
Differential Interferograms: examples S4 Ascending T127 Master: 20060322; Slave: 20051207 Bt=105 [days] Bn=175 [m] π wrapped wrapped wrapped -π -41 unwrapped unwrapped unwrapped radians 76
Difficulties in phase unwrapping Master: 20031130; Slave: 20030921 Bt=70 [days] Bn=29 [m] How to solve very fast motion and abrupt changes in the crater area? Differentials present very fast fringes: phase unwrapping has to be solved in a nonconventional way • The adopted solution consists in: • Use of baselines smaller than 650 meters and 210 days • Goldstein filtering • 3D unwrapping (2D spatial + time)
Master CASE 1 A unique coherent temporal cluster of images is found: in this case a unique time series is given for the analyzed pixel. The displacement rate is computed as the linear trend of the time series CASE 2 If it is not possible to find an entire coherent time interval, the whole time span is divided in two or more independent subsets, represented in the aside image in different colors. Each temporal cluster has its own master (instant of reference with displacement equal to zero). The displacement rate is computed as the linear trend of the longest temporal cluster. Each pixel will have its own number and duration ofsub-clusters. “Holes” (that is, not used images) are possible. Master 1 Master 2 Master 3 Cluster 1 Cluster 2 Cluster 3 Displacement rate and time series Conventionally, PSInSARTM uses all the images of the dataset and selects those pixels that show a trend in time consistent with the applied model for velocity: average displacement rate and time series for such pixels are computed. In the Piton case the application of this approach would cause the loss of a great part of the pixels in the area: many pixels don’t obey to the model for the whole period of observation, because of eruptions or seismic events, that yields to strong changes and subsequently to the loss of coherence. Two cases are therefore possible:
S2 Ascending T84 Velocity Field Velocity along Line of Sight is computed as the linear trend of the longest temporal cluster
S2 Ascending T84 Time Series: examples 1 master 2 3 1 3 2 master master
S2 Ascending T84 Time Series: examples 7 master master master 9 7 8 9 8 master master master master master master Each color represents a coherent temporal clusterfor the pixel in analysis. Connection among different temporal clusters is NOT significant: no information about what happens amongthe two is detectable from the data.
S4 Ascending T127 Velocity Field Velocity along Line of Sight is computed as the linear trend of the longest temporal cluster
S4 Ascending T127 Time Series: examples 1 master 1 3 2 3 master master 2
S4 Ascending T127 Time Series: examples 7 master master 7 8 9 9 master master master 8 master master master Each color represents a coherent temporal clusterfor the pixel in analysis. Connection among different temporal clusters is NOT significant: no information about what happens amongthe two is detectable from the data.
Piton results Visualization http://maps.treuropa.com Web tool for results visualization, As support to validation activity done by IPGP. Velocity field Time Series No GIS software require for a quick results browsing Powered on Google MapsTM
Piton, Conclusions • 131 Envisat scenes successfully processed (4 datasets: Ascending S2 and S4; descending S2 and S4) • Descending results temporarily discarded due to geometrical decorrelation and foreshortening problems: no chance of extraction of time series and average deformation trends. • Because of fast motion and abrupt changes, an advanced approach of PSInSAR tailored over the specific situation of the Piton volcano has been carried out, requiring interaction with skilled personnel • From ascending interferograms (both S2 and S4 datasets) deformation rate and time series of displacement have been extracted over the crater area • In order to extract all the available information, different temporal cluster have been exploited, in order to provide time series also for those pixel that don’t show coherence for the whole period of observation • Ad-hoc visualization procedures should be developed: each pixel can be associated to many time series. A clear methodology for data archiving and data representation should be pointed in cooperation with the final user.
Vulcano and Stromboli datasets ASCENDING Track 129 S2 • 37 scenes (revisiting time=35 days) • Time range of investigation: January 11st 2003 – November 7th 2007 • Master acquisition (temporal reference): January 11st 2006 θ ≈ 24.0 [deg] α ≈ 12.0 [deg] DESCENDING Track 494 S2 • 30 processed scenes (revisiting time=35 days) • Time range of investigation: July 7th 2003 – October 10th 2007 • Master acquisition (temporal reference): September 19th 2005 θ ≈ 22.3 [deg] α ≈ 12.2 [deg]
Stromboli Geocoded Multi-Image Reflectivity layover Ascending Descending
Clusters of PS candidates az rg Three separated clusters are formedto estimate and remove atmospheric signal; from now on, PS analysis willcontinue independently for the threeregions Cluster 1 Cluster 6 Cluster 15 Stromboli Ascending datasetPhase Stability Index and Clusters Phase Stabilty Index(a-priori coherence) • The Phase Stability Index shows areas where phase information is candidate to be coherent • Three “coherent” areas (bright) are detectable, separated by large non-coherent areas (dark) • Despite different attempts of connecting this three areas, none of them has been considered reliable after quality check evaluation
Stromboli Descending dataset: differentials IMPORTANT: as shown by interferograms given as example, fast motion and non-linear behavior is present in the area. Time series extraction is a challenging task that requires further analysis, to solve unwrapping problems related with non linear displacements, above all in the “Sciara del Fuoco” area.
Stromboli Velocity field, along LOS Ascending Velocity field, along LOS Descending Velocity field, along LOS
Stromboli Results, summary • Results divided into 3 clusters because of coherence problems • 1363 PS detected (with Time Series) over the island (~13 Kmq) • Geometrical distortions prevent from PS detection on the western slope of the volcano ASCENDING DESCENDING • IMPORTANT: as shown by the interferograms reported previously, fast motion and non-linear behavior is present in the area. Unfortunately, the uneven temporal sampling of the ENVISAT data-set as well as the presence of fast temporal decorrelation phenomena do not allow the reconstruction of reliable time series of the displacement field. • 698 PS detected (with Time Series) over the island (~13 Kmq) • Geometrical distortions prevent from PS detection on the eastern slope of the volcano • ==> To get better InSAR results it is recommended to use SAR data with a shorter repeat cycle and – given the extent of the AOI – higher spatial resolution
Vulcano, Geocoded Multi-Image Reflectivity Ascending Descending
Vulcano Results Velocity field, along LOS Velocity field, along LOS
Decomposition in East and Vertical velocities Ascending and descending results both cover the crater area and other parts of the island: wherever the two data are simultaneously available, adecomposition from ascending and descending displacement to easting and vertical components is possible, on a grid of 100x100 meters resolution Easting velocity field Vertical velocity field west east down up
Vulcano Results, summary ASCENDING • 2299 PS detected (with Time Series) over the island (~21 Kmq) • Even though geometrical distortions prevent from PS detection in some parts of the volcano, results have a good distribution and coverage • 2323 PS detected (with Time Series) over the island (~21 Kmq) • Even though some area of the island are not covered by PS because of perspective distortions, coverage and density of measurements are fine DESCENDING