Download
1 / 25
250 likes | 513 Vues
The Demographic Transition Model. The Demographic Transition Model. generalization that depicts a countries development from a pre-industrial society to a post-industrial society and beyond Describes changing levels of fertility and mortality as well as general levels of population growth

E N D
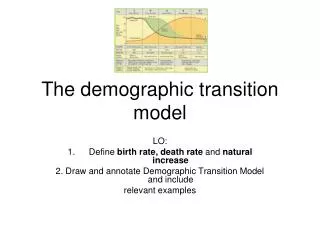
The Demographic Transition Model • generalization that depicts a countries development from a pre-industrial society to a post-industrial society and beyond • Describes changing levels of fertility and mortality as well as general levels of population growth • Based on known facts rather than general assumption
The Demographic Transition Model As we go through, consider these questions: What countries might be in each stage? Where are the core, periphery and semi-periphery countries?
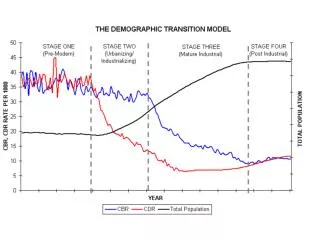
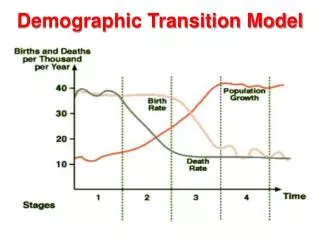
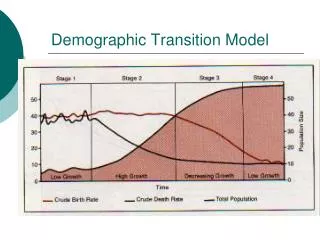
Stage 1: High Stationary / Pre-Transition • High birth rate and high death rate • Two rates are nearly equal • Death rate fluctuating likely due to war and disease • Involves a low-income agricultural economy • Children are less of an expense and more of a commodity • Population growth is very slow • Population resides in rural areas • Countries? Core, periphery or semi-periphery?
Stage 2: Expanding Stage / Early Transition • Birth rate remains high • Death rate begins to fall rapidly • Results in population explosion • Early industrialization paralleled with medical and health advances • Infant mortality declines, life expectancy increases • This stage characterizes nations in early development • Countries? Core, periphery or semi-periphery?
Stage 3: Late Expanding Stage / Late Transition • Principle feature is a declining birth rate which is the result of voluntary decisions to reduce family size and the availability of contraceptives • Increased standards of living • Rate of Natural Increase is falling • The cost of children is increasing • Medical advancements continuing to decrease death rate • Population still increasing relatively quickly • Countries? Core, periphery or semi-periphery?
Stage 4: Low Growth Stage / Post Transition • Birth rate remains slightly above the death rate • Rate of Natural Increase is low • Population growth is low and stable • Women entering workforce, couples postponing families while educational goals are sought • Population viewed as ‘greying’ or ‘aging’ • Canada would fall into this stage of the DTM • Countries? Core, periphery or semi-periphery?
Stage 5: Deindustrialization / Declining • The population is declining • Characterizes countries with present and predicted negative population growth rates such as Russia and many European countries • Death rate begins to exceed the birth rate • Countries? Core, periphery or semi-periphery?
Relationship to Population Pyramids • By analyzing population pyramids, one can decipher fairly accurately the stage of the demographic transition model that that particular country is in and vice versa • In combination with each other and if the model holds true, a countries future growth and development can be predicted • Shortcoming of the Demographic Transition Model: does not provide a bold hypothesis about future growth or decline