Download
1 / 77
770 likes | 955 Vues
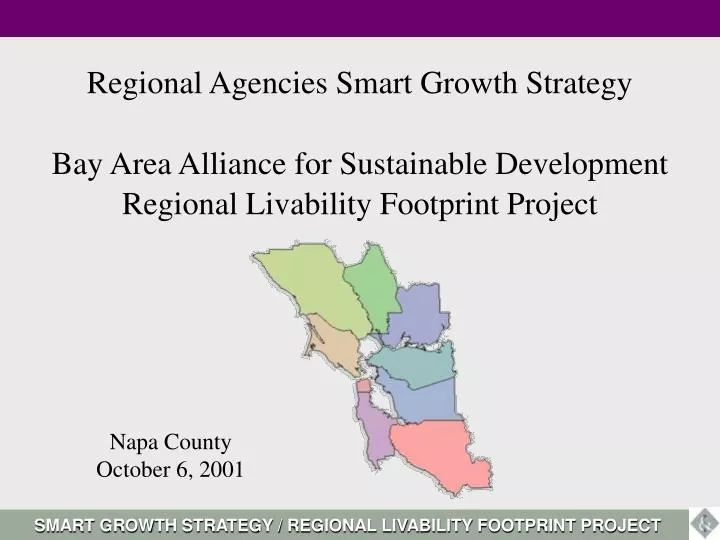
Regional Agencies Smart Growth Strategy Bay Area Alliance for Sustainable Development Regional Livability Footprint Project. Napa County October 6, 2001. SMART GROWTH STRATEGY / REGIONAL LIVABILITY FOOTPRINT PROJECT. Napa County Co-Sponsors Napa County Board of Supervisors

E N D
Regional Agencies Smart Growth Strategy Bay Area Alliance for Sustainable Development Regional Livability Footprint Project Napa County October 6, 2001 SMART GROWTH STRATEGY / REGIONAL LIVABILITY FOOTPRINT PROJECT
Napa County Co-Sponsors • Napa County Board of Supervisors • Napa County Farm Bureau • Napa County League of Municipalities • Napa County Transportation Planning Agency • Napa Valley Economic Development Corporation • Central Labor Council of Napa & Solano Counties AFL-CIO • Get a Grip on Growth • Napa Valley Grape Growers Association • North Bay Association of Realtors • Winegrowers of Napa County • Special thanks to the Napa County Transportation Planning Agency for providing food and refreshments for today’s event. SMART GROWTH STRATEGY / REGIONAL LIVABILITY FOOTPRINT PROJECT
SPONSORING AGENCIES SMART GROWTH STRATEGY Regional Agencies • Association of Bay Area Governments (ABAG) • Metropolitan Transportation Commission (MTC) • Bay Area Air Quality Management District (BAAQMD) • Bay Conservation and Development Commission (BCDC) • Regional Water Quality Control Board (RWQCB) SMART GROWTH STRATEGY / REGIONAL LIVABILITY FOOTPRINT PROJECT
SPONSORING AGENCIES REGIONAL LIVABILITY FOOTPRINT PROJECT Bay Area Alliance for Sustainable Development 45 Member Organizations Steering Committee consists of organizations representing the Three E’s of Smart Growth and Sustainable Development: Government: Association of Bay Area Governments Prosperous Economy: Bay Area Council Quality Environment: Sierra Club Social Equity: Urban Habitat Program SMART GROWTH STRATEGY / REGIONAL LIVABILITY FOOTPRINT PROJECT
BAY AREA TRENDS Through 2020 • 1 million new jobs • 1 million more people • 265,000 daily in-commutersto the region • 150% increase in aggregate traffic congestion • Conversion of up to 83,000 acres of currently undeveloped land • 44% decrease in households able to afford the median priced home from 1995 to 2001 1995 to 2001 SMART GROWTH STRATEGY / REGIONAL LIVABILITY FOOTPRINT PROJECT CONCLUSION IMPLEMENTATION KEY ECONOMIC ISSUES
REGIONAL POPULATION GROWTH Natural Increase (“Our own children”) Net Migration (“Other People”) 50% 50% (approximate figures) SMART GROWTH STRATEGY / REGIONAL LIVABILITY FOOTPRINT PROJECT CONCLUSION IMPLEMENTATION KEY ECONOMIC ISSUES
CHOICES ABOUT FUTURE GROWTH • Expand housing? • Constrain future job growth? • Expand infrastructure to handle in-commuters? Find a smarter way to grow SMART GROWTH STRATEGY / REGIONAL LIVABILITY FOOTPRINT PROJECT CONCLUSION IMPLEMENTATION KEY ECONOMIC ISSUES
PHILOSOPHY • Bottom-up • Broad participation • Build on local efforts SMART GROWTH STRATEGY / REGIONAL LIVABILITY FOOTPRINT PROJECT CONCLUSION IMPLEMENTATION KEY ECONOMIC ISSUES
GOALS • Smart growth land use changes supported by local governments. • A regional incentive package and implementation strategies. • A set of smart growth land use projections. SMART GROWTH STRATEGY / REGIONAL LIVABILITY FOOTPRINT PROJECT CONCLUSION IMPLEMENTATION KEY ECONOMIC ISSUES
SMART GROWTH PRINCIPLES The Three E’s of Smart Growth and Sustainable Development: Prosperous Economy Quality Environment Social Equity SMART GROWTH STRATEGY / REGIONAL LIVABILITY FOOTPRINT PROJECT
SMART GROWTH PRINCIPLES • Efficiently accommodate projected growth. • Provide sufficient affordable housing. • Revitalize central cities and older suburbs. • Reduce single occupant vehicle trips. • Preserve open space and agricultural land. • Foster equitable economic development while minimizing displacement. SMART GROWTH STRATEGY / REGIONAL LIVABILITY FOOTPRINT PROJECT CONCLUSION IMPLEMENTATION KEY ECONOMIC ISSUES
SAMPLE DEVELOPMENT CONCEPTS • Revitalization of existing communities. • Efficient design for edge development. • Development near transit service. • Mixed use. • Efficient density. • Mixed incomes. SMART GROWTH STRATEGY / REGIONAL LIVABILITY FOOTPRINT PROJECT CONCLUSION IMPLEMENTATION KEY ECONOMIC ISSUES
PROCESS Public Workshop Round 1 September and October 2001 Distillation and Analysis Public Workshop Round 2 March and April 2001 Final Steps SMART GROWTH STRATEGY / REGIONAL LIVABILITY FOOTPRINT PROJECT CONCLUSION IMPLEMENTATION KEY ECONOMIC ISSUES
PUBLIC WORKSHOPS - ROUND ONE • Smart growth principles • Land use mapping exercise • Regulatory changes and incentives SMART GROWTH STRATEGY / REGIONAL LIVABILITY FOOTPRINT PROJECT CONCLUSION IMPLEMENTATION KEY ECONOMIC ISSUES
PLACE3S: ANALYTICAL & MAPPING POWER OF GIS HOUSING UNITS . . . . . . . . . . . . . . . . . . . . JOBS . . . . . . . . . . . . . . . . . . . . . . . . . . . . . . . OPEN SPACE . . . . . . . . . . . . . . . . . . . . . . . . WATER CONSUMPTION . . . . . . . . . . . . . . PEDESTRIAN QUALITY . . . . . . . . . . . . . . . SMART GROWTH STRATEGY / REGIONAL LIVABILITY FOOTPRINT PROJECT CONCLUSION IMPLEMENTATION KEY ECONOMIC ISSUES
DISTILLATION & ANALYSIS • Three region-wide thematic alternatives • Analysis of alternatives and existing trends: • Housing Affordability • Jobs/Housing Match • Market Displacement and Social Equity • Transportation and Air Quality Modeling • Development Feasibility SMART GROWTH STRATEGY / REGIONAL LIVABILITY FOOTPRINT PROJECT CONCLUSION IMPLEMENTATION KEY ECONOMIC ISSUES
PUBLIC WORKSHOPS - ROUND TWO • Review results of first workshop. • Address subregional issues. • Recommend preferred alternative. • Develop regulatory changes and incentives. SMART GROWTH STRATEGY / REGIONAL LIVABILITY FOOTPRINT PROJECT CONCLUSION IMPLEMENTATION KEY ECONOMIC ISSUES
FINAL STEPS • BAASD coordinates a Public Education and Engagement Campaign • ABAG Board considers adoption of Projections forecast • MTC’s Regional Transportation Plan • Other regional plans • Regional regulatory changes and incentives • Local implementation SMART GROWTH STRATEGY / REGIONAL LIVABILITY FOOTPRINT PROJECT CONCLUSION IMPLEMENTATION KEY ECONOMIC ISSUES
RELATIONSHIP TO OTHER PROCESSES • General Plans • Revised Regulatory Framework • Additional Incentives • Regional Context • Housing Allocations SMART GROWTH STRATEGY / REGIONAL LIVABILITY FOOTPRINT PROJECT CONCLUSION IMPLEMENTATION KEY ECONOMIC ISSUES
RELATIONSHIP TO DRAFT COMPACT SMART GROWTH STRATEGY / REGIONAL LIVABILITY FOOTPRINT PROJECT CONCLUSION IMPLEMENTATION KEY ECONOMIC ISSUES
OUR REGIONAL GROWTH CHALLENGES • Open Space and Agricultural Preservation • Traffic Mobility and Congestion • Housing Availability and Affordability • Livability and Community Vitality • Social and Economic Equity SMART GROWTH STRATEGY / REGIONAL LIVABILITY FOOTPRINT PROJECT CONCLUSION IMPLEMENTATION KEY ECONOMIC ISSUES
OPEN SPACE AND AGRICULTURAL PRESERVATION Napa Valley SMART GROWTH STRATEGY / REGIONAL LIVABILITY FOOTPRINT PROJECT CONCLUSION IMPLEMENTATION KEY ECONOMIC ISSUES
OPEN SPACE AND AGRICULTURAL PRESERVATION Land has been urbanized 2 1/2 times faster than urban population has increased 1950 Population (millions) 300 200 400 100 Urban Population 70 Urbanized Land 13,000 45,000 30,000 60,000 15,000 Urbanized Land (square miles) 1990 Population (millions) 300 200 400 100 Urban Population 150 60,000 Urbanized Land 45,000 30,000 60,000 15,000 Urbanized Land (square miles) Source: National Geographic SMART GROWTH STRATEGY / REGIONAL LIVABILITY FOOTPRINT PROJECT KEY ECONOMIC ISSUES IMPLEMENTATION CONCLUSION
OPEN SPACE AND AGRICULTURAL PRESERVATION Lands Projected for Development through 2020 Projected for Development Through 2020 3,000 acres subject to conversion Public Land or Privately Protected Land Owned in Fee ConservationEasement Urban Areas SMART GROWTH STRATEGY / REGIONAL LIVABILITY FOOTPRINT PROJECT CONCLUSION IMPLEMENTATION KEY ECONOMIC ISSUES
OPEN SPACE AND AGRICULTURAL PRESERVATION County Measure J Agricultrural Preserve County Measure A Housing Allocation Program Napa City Measure A City Urban Growth Boundaries Urban Growth Boundaries SMART GROWTH STRATEGY / REGIONAL LIVABILITY FOOTPRINT PROJECT CONCLUSION IMPLEMENTATION KEY ECONOMIC ISSUES
TRAFFIC MOBILITY AND CONGESTION VMT Increasing Faster Than Population 2000-2020 Vehicle-Hours of Delay 150% Increase 900,000 854,600 30% 28% 800,000 25% 700,000 600,000 20% 500,000 14% 15% 400,000 339,100 10% 300,000 5% 200,000 100,000 0% VMT Increase Population Increase 0 1998 2025 SMART GROWTH STRATEGY / REGIONAL LIVABILITY FOOTPRINT PROJECT IMPLEMENTATION CONCLUSION KEY ECONOMIC ISSUES
TRAFFIC MOBILITY AND CONGESTION In-Commuters to Bay Area Increase (thousands of persons/year) Commute Mode Split Remains Unchanged (millions of trips/day) 300 6 250 5 200 4 3 150 Cars 2 100 1 50 Transit Walk, bike 0 0 1990 2020 1990 2020 SMART GROWTH STRATEGY / REGIONAL LIVABILITY FOOTPRINT PROJECT KEY ECONOMIC ISSUES CONCLUSION IMPLEMENTATION
NAPA COUNTY DAILY IN-COMMUTERS Yolo County 906 Sonoma County 1,632 Sacramento 2,672 13,942 Solano County Source: MTC SMART GROWTH STRATEGY / REGIONAL LIVABILITY FOOTPRINT PROJECT CONCLUSION IMPLEMENTATION KEY ECONOMIC ISSUES
TRAFFIC MOBILITY AND CONGESTION Vehicle Miles Traveled Per Year 20,000 15,000 10,591 10,000 6,455 4,779 5,000 0 Suburban Neighborhood Urban Center Traditional Neighborhood (Rockridge) (San Ramon) (San Francisco) SMART GROWTH STRATEGY / REGIONAL LIVABILITY FOOTPRINT PROJECT CONCLUSION IMPLEMENTATION KEY ECONOMIC ISSUES
TRAFFIC MOBILITY AND CONGESTION Calistoga SMART GROWTH STRATEGY / REGIONAL LIVABILITY FOOTPRINT PROJECT CONCLUSION IMPLEMENTATION KEY ECONOMIC ISSUES
TRAFFIC MOBILITY AND CONGESTION Riverfront Plan Napa Illustrations from Urban Advantage SMART GROWTH STRATEGY / REGIONAL LIVABILITY FOOTPRINT PROJECT CONCLUSION IMPLEMENTATION KEY ECONOMIC ISSUES
TRAFFIC MOBILITY AND CONGESTION Community Hall Master Plan Yountville Community Development by Design SMART GROWTH STRATEGY / REGIONAL LIVABILITY FOOTPRINT PROJECT CONCLUSION IMPLEMENTATION KEY ECONOMIC ISSUES
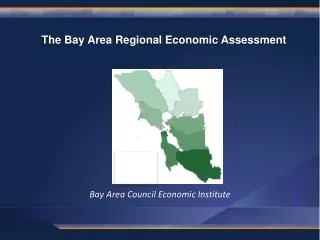
HOUSING AVAILABILITY AND AFFORDABILITY Bay Area Jobs and Employed Residents by County, 2000 1,200,000 1,000,000 800,000 Total Jobs 600,000 Total Employed Residents 400,000 200,000 Marin Napa Solano Sonoma Alameda San Mateo Santa Clara Contra Costa San Francisco SMART GROWTH STRATEGY / REGIONAL LIVABILITY FOOTPRINT PROJECT CONCLUSION IMPLEMENTATION KEY ECONOMIC ISSUES
HOUSING AVAILABILITY AND AFFORDABILITY Projected Growth in Jobs and Employed Residents 2000-2020 300,000 250,000 Jobs Employed Residents 200,000 150,000 100,000 50,000 - Marin Napa Marin Napa Solano Solano Alameda Sonoma Sonoma Alameda San Mateo San Mateo Santa Clara Santa Clara Contra Costa San Francisco Contra Costa San Francisco SMART GROWTH STRATEGY / REGIONAL LIVABILITY FOOTPRINT PROJECT CONCLUSION IMPLEMENTATION KEY ECONOMIC ISSUES
HOUSING AVAILABILITY AND AFFORDABILITY • The jobs/housing challenge • 2000-2020 • Projected job growth: 30,000 jobs • Resulting housing need: 15,000-20,000 units SMART GROWTH STRATEGY / REGIONAL LIVABILITY FOOTPRINT PROJECT CONCLUSION IMPLEMENTATION KEY ECONOMIC ISSUES
HOUSING AVAILABILITY AND AFFORDABILITY Affordability Gap for Median-Income Households $600,000 $500,000 Home Price Affordable to Median 4 Person Household $400,000 Median Home Market Price $300,000 $200,000 $100,000 - Contra Costa / Alameda San Francisco/ San Mateo/Marin Solano/Napa Sonoma County Santa Clara County SMART GROWTH STRATEGY / REGIONAL LIVABILITY FOOTPRINT PROJECT KEY ECONOMIC ISSUES CONCLUSION IMPLEMENTATION
HOUSING AVAILABILITY AND AFFORDABILITY INCOME CATEGORIES FOR A FAMILY OF FOUR Median Income - $55,700 VERY LOW INCOME 0-$27,850 Child Care Worker $16,110 Retail Clerk $19,140 — — Medical Assistant $25,430 — LOW INCOME $27,850-$44,560 Elementary School Teacher $34,490 Accountant $43,610 — — MODERATE INCOME $44,560-$66,840 $50,230 Police Patrol Office $61,500 Registered Nurse — — SMART GROWTH STRATEGY / REGIONAL LIVABILITY FOOTPRINT PROJECT CONCLUSION IMPLEMENTATION KEY ECONOMIC ISSUES
HOUSING AVAILABILITY AND AFFORDABILITY • Housing need by affordability category: • Very low income: 20% • Low income: 14% • Moderate income: 25% • Above moderate income: 41% SMART GROWTH STRATEGY / REGIONAL LIVABILITY FOOTPRINT PROJECT CONCLUSION IMPLEMENTATION KEY ECONOMIC ISSUES
HOUSING AVAILABILITY AND AFFORDABILITY SINGLE PARENTS WITH CHILDREN 8% SINGLES 30% MULTI-FAMILY 37% FAMILIES WITH SINGLE-FAMILY DETACHED NO CHILDREN 36% 63% FAMILIES WITH CHILDREN 26% BAY AREA HOUSING PERMITS JAN-SEP 2000 HOUSEHOLD COMPOSITION 2000 SMART GROWTH STRATEGY / REGIONAL LIVABILITY FOOTPRINT PROJECT CONCLUSION IMPLEMENTATION KEY ECONOMIC ISSUES
HOUSING AVAILABILITY AND AFFORDABILITY Silverado Creek Affordable Housing Napa SMART GROWTH STRATEGY / REGIONAL LIVABILITY FOOTPRINT PROJECT
HOUSING AVAILABILITY AND AFFORDABILITY La Pradera Affordable Housing Calistoga SMART GROWTH STRATEGY / REGIONAL LIVABILITY FOOTPRINT PROJECT
HOUSING AVAILABILITY AND AFFORDABILITY Stonebridge Apartments Special Needs Housing St. Helena SMART GROWTH STRATEGY / REGIONAL LIVABILITY FOOTPRINT PROJECT
HOUSING AVAILABILITY AND AFFORDABILITY In-Law Unit SMART GROWTH STRATEGY / REGIONAL LIVABILITY FOOTPRINT PROJECT CONCLUSION IMPLEMENTATION KEY ECONOMIC ISSUES
LIVABILITY AND COMMUNITY VITALITY SMART GROWTH STRATEGY / REGIONAL LIVABILITY FOOTPRINT PROJECT CONCLUSION IMPLEMENTATION KEY ECONOMIC ISSUES
SOCIAL AND ECONOMIC EQUITY The Bay Area’s 46 Most Impoverished Neighborhoods (NCCC 1997) Very low-income neighborhoods need reinvestment while minimizing displacement These neighborhood residents need access to quality jobs SMART GROWTH STRATEGY / REGIONAL LIVABILITY FOOTPRINT PROJECT CONCLUSION IMPLEMENTATION KEY ECONOMIC ISSUES
SOCIAL AND ECONOMIC EQUITY Impoverished Communities In Napa County Definition of Impoverished Community: Areas where a majority of households earn less than 80% of the County median income (1990) SMART GROWTH STRATEGY / REGIONAL LIVABILITY FOOTPRINT PROJECT
SOCIAL AND ECONOMIC EQUITY Impoverished neighborhoods: • Can benefit from Smart Growth • May be significantly affected by Smart Growth SMART GROWTH STRATEGY / REGIONAL LIVABILITY FOOTPRINT PROJECT CONCLUSION IMPLEMENTATION KEY ECONOMIC ISSUES
Regional Agencies Smart Growth Strategy Bay Area Alliance for Sustainable Development Regional Livability Footprint Project Napa County October 6, 2001 SMART GROWTH STRATEGY / REGIONAL LIVABILITY FOOTPRINT PROJECT
SMALL GROUP EXERCISE GOAL Identify the most appropriate patterns for smart growth in Napa County. SMART GROWTH STRATEGY / REGIONAL LIVABILITY FOOTPRINT PROJECT CONCLUSION IMPLEMENTATION KEY ECONOMIC ISSUES
SMALL GROUP EXERCISE • Smart Growth Principles • Land Use Mapping Exercise • Affordable Housing • Regulatory Changes and Incentives SMART GROWTH STRATEGY / REGIONAL LIVABILITY FOOTPRINT PROJECT CONCLUSION IMPLEMENTATION KEY ECONOMIC ISSUES