Download
1 / 16
160 likes | 270 Vues
WP 3 : Absorbing Aerosol Index (AAI) WP 10 : Level-1 validation. L.G. Tilstra 1 , I. Aben 2 , and P. Stammes 1 1 Royal Netherlands Meteorological Institute (KNMI) 2 Netherlands Institute for Space Research (SRON). SCIAvisie Meeting, SRON, Utrecht, 20-01-2012.

E N D
WP 3 : Absorbing Aerosol Index (AAI)WP 10 : Level-1 validation L.G. Tilstra1, I. Aben2, and P. Stammes1 1Royal Netherlands Meteorological Institute (KNMI) 2Netherlands Institute for Space Research (SRON) SCIAvisie Meeting, SRON, Utrecht, 20-01-2012
WP 3: Absorbing Aerosol Index (AAI) • Instrument degradation has a large impact on the AAI • M-factors do not correct sufficiently for instrument degradation • We developed a new method for in-flight reflectance degradation correction [correcting the Earth reflectance] • What is the quality of the resulting AAI? Have the effects of instrument degradation disappeared completely? SCIAvisie Meeting, SRON, Utrecht, 20-01-2012
Quality check: have a look at time series of the AAI Typical yearly recurring desert dust or biomass burning events: Regions A and B A B SCIAvisie Meeting, SRON, Utrecht, 20-01-2012
Van der Werf et al., ACP, 2010 Carbon emission (Tg C / month) A) Borneo 1997/1998 El Niño: drought caused many forest fires; 120.000 km2 forest burned. (running mean 31 days) Comparison with fire emission estimates for roughly the same region is ok. Good qualitative agreement. No clear trend visible.
B) West Africa – biomass burning Tropospheric NO2 column: good correlation with AAI. No clear trend in AAI visible. Pixel-to-pixel comparison: correlation is there, but less clear. Regional averages of tropospheric NO2 column and AAI correlate quite well to each other.
WP 3: Conclusions Instrument degradation can be treated successfully using the developed in-flight reflectance degradation correction method. No trends were found in the time series of the AAI. For biomass burning regions the tropospheric NO2 column can provide a valuable reference for the interpretation of AAI time series. The seasonal variation of regional mean AAI for biomass burning regions (West Africa, Amazonia, the Sahel) agrees well with the seasonal variation of the mean tropospheric NO2 column for that region. SCIAvisie Meeting, SRON, Utrecht, 20-01-2012
WP 10: Level-1 validation • We had a look at “version 8” level-1 TEST data containing new (time-dependent) radiometric key data produced by SRON • Available data: one month (October 2008); version 8 and 7 • M-factors for version 8 are not needed: correction for instrument degradation is contained in the radiometric key data SCIAvisie Meeting, SRON, Utrecht, 20-01-2012
Spectral analysis of the changes for one measurement from orbit 34530: Plotted is the radiance | irradiance | reflectance ratio (v8/v7) October 7, 2008 orbit 34530 v7: m-factors applied to correct for instrument degradation Strong change in solar irradiance, especially in channels 7 and 8. Irradiance of v7 was validated. SCIAvisie Meeting, SRON, Utrecht, 20-01-2012
Spectral features: spectral feature removed? reflectances of channels 2 and 3 are inconsistent near overlap region 2/3 (v8) channel 2 (v7) One spectral feature [introduced in v6.0x] seems to have been removed, but the spectrum still looks unrealistic (bumpy, deformed). In the overlap region of channel 2 and 3 there is now a large discrepancy. SCIAvisie Meeting, SRON, Utrecht, 20-01-2012
Absorbing Aerosol Index (AAI): October 2008 REFERENCE v6.03 + m-factors • scan-angle dependency due to instrument degradation is smaller in “v8”, but still larger than expected • offset in global mean residue due to instrument degradation has been reduced compared to “m-factors” • downward trend in “v8” is a bit suspicious v8 (new key data) SCIAvisie Meeting, SRON, Utrecht, 20-01-2012
Plans for WP 3: • Keep improving the scientific AAI product (SC-AAI) • Include spectral dependence of surface albedo into algorithm • Continue the improvement and validation of the L2-AAI • Maintain SC-AAI data archive at the TEMIS website • Further study the scan-angle dependent degradation for support of WP 10 Plans for WP 10: • Verify improvement in calibration by new processor updates • Monitor instrument degradation and analyse the quality of the applied degradation correction (“m-factors”) in the UV using the Absorbing Aerosol Index (AAI) and using in-flight monitoring of level-1 data • Monitor and validate polarisation product using special geometries • Analyse the reflectance over specific stable Earth targets SCIAvisie Meeting, SRON, Utrecht, 20-01-2012
Extra slides SCIAvisie Meeting, SRON, Utrecht, 20-01-2012
Introduction: Absorbing Aerosol Index (AAI) The AAI represents the scene colour in the UV • Definition of the residue: where the surface albedo A for the simulations is such that: (A is assumed to be wavelength independent: A340 = A380) no clouds, no aerosols : r = 0 clouds, scattering aerosols : r < 0 absorbing aerosols : r > 0 B. Definition of the AAI: AAI = residue > 0 (and the AAI is not defined where residue < 0) The AAI can be retrieved over land and sea surfaces, even in the presence of clouds. SCIAvisie Meeting, SRON, Utrecht, 20-01-2012
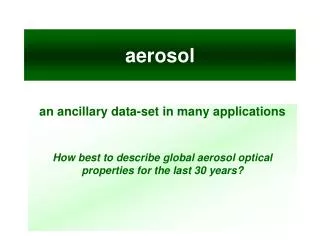
Example of global aerosol distribution recorded by SCIAMACHY: The “Global Dust Belt”: Desert Dust Aerosols (DDA) (dust storms, all year) Biomass Burning Aerosols (BBA) (dry season, anthropogenic) AAI from other UV satellite instruments: TOMS, GOME-1, OMI, GOME-2. Combined with SCIAMACHY there are more than three decades (1978–2012) of AAI data available for studies of trends in desert dust and biomass burning aerosol. SCIAvisie Meeting, SRON, Utrecht, 20-01-2012
The “Global Dust Belt” SCIAvisie Meeting, SRON, Utrecht, 20-01-2012
AAI products from GOME-1, SCIAMACHY, GOME-2, and OMI: *GOME-1: loss of global coverage on 22 June 2003 ; instrument retired on 4 July 2011 SCIAvisie Meeting, SRON, Utrecht, 20-01-2012