Download
1 / 61
610 likes | 618 Vues
Role of Computer and Information Science in Biology Presented By Dr G. P. S. Raghava Co-ordinator, Bioinformatic Centre, IMTECH, Chandigarh, India & Visiting Professor, Pohang Univ. of Science & Technology, Republic of Korea Email: raghava@imtech.res.in

E N D
Role of Computer and Information Science in Biology Presented By Dr G. P. S. Raghava Co-ordinator, Bioinformatic Centre, IMTECH, Chandigarh, India & Visiting Professor, Pohang Univ. of Science & Technology, Republic of Korea Email: raghava@imtech.res.in Web: http://www.imtech.res.in/raghava/
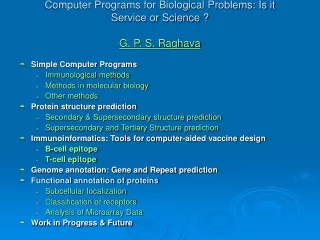
Major Applications & Challenges • Introduction to Biology • Genome Annotation: Gene Prediction • Analysis and Comparison of Sequences • Protein Structure Prediction • DNA Chip (Microarray) technology • Proteomics: Analysis of 2D gel • Fingerprinting Technique • Drug development • Computer-Aided Vaccine Design
Hierarchy in Biology Atoms Molecules Macromolecules Organelles Cells Tissues Organs Organ Systems Individual Organisms Populations Communities Ecosystems Biosphere
Sequence to Structure:It’s a matter of dimensions! • 1D Nucleic acid sequence AGT-TTC-CCA-GGG… • 1D Protein sequence Met-Ala-Gly-Lys-His… M – A – G – K – H… • 3D Spatial arrangement of atoms
Genome Annotation The Process of Adding Biology Information and Predictions to a Sequenced Genome Framework
Importance of Sequence Comparison • Protein Structure Prediction • Similar sequence have similar structure & function • Phylogenetic Tree • Homology based protein structure prediction • Genome Annotation • Homology based gene prediction • Function assignment & evolutionary studies • Searching drug targets • Searching sequence present or absent across genomes
Protein Sequence Alignment and Database Searching Alignment of Two Sequences (Pair-wise Alignment) The Scoring Schemes or Weight Matrices Techniques of Alignments DOTPLOT Multiple Sequence Alignment (Alignment of > 2 Sequences) Extending Dynamic Programming to more sequences Progressive Alignment (Tree or Hierarchical Methods) Iterative Techniques Stochastic Algorithms (SA, GA, HMM) Non Stochastic Algorithms Database Scanning FASTA, BLAST, PSIBLAST, ISS Alignment of Whole Genomes MUMmer (Maximal Unique Match)
Dealing Gaps in Pair-wise Alignment Sequence Comparison without Gaps Slide Windos method to got maximum score ALGAWDE ALATWDE Total score= 1+1+0+0+1+1+1=5 ; (PID) = (5*100)/7 Sequence with variable length should use dynamic programming Sequence Comparison with Gaps Insertion and deletion is common Slide Window method fails Generate all possible alignment 100 residue alignment require > 1075 Alignment of Two Sequences
Alternate Dot Matrix PlotDiagnoal * shows align/identical regions
Dynamic Programming • Dynamic Programming allow Optimal Alignment between two sequences • Allow Insertion and Deletion or Alignment with gaps • Needlman and Wunsh Algorithm (1970) for global alignment • Smith & Waterman Algorithm (1981) for local alignment • Important Steps • Create DOTPLOT between two sequences • Compute SUM matrix • Trace Optimal Path
Alignment of Multiple Sequences Extending Dynamic Programming to more sequences Dynamic programming can be extended for more than two In practice it requires CPU and Memory (Murata et al 1985) MSA, Limited only up to 8-10 sequences (1989) DCA (Divide and Conquer; Stoye et al., 1997), 20-25 sequences OMA (Optimal Multiple Alignment; Reinert et al., 2000) COSA (Althaus et al., 2002) Progressive or Tree or Hierarchical Methods (CLUSTAL-W) Practical approach for multiple alignment Compare all sequences pair wise Perform cluster analysis Generate a hierarchy for alignment first aligning the most similar pair of sequences Align alignment with next similar alignment or sequence
Database scanning Basic principles of Database searching Search query sequence against all sequence in database Calculate score and select top sequences Dynamic programming is best Approximation Algorithms FASTA Fast sequence search Based on dotplot Identify identical words (k-tuples) Search significant diagonals Use PAM 250 for further refinement Dynamic programming for narrow region
Database Scanning or Fold Recognition • Concept of PSIBLAST • Perform the BLAST search (gap handling) • GeneImprove the sensivity of BLAST • rate the position-specific score matrix • Use PSSM for next round of search • Intermediate Sequence Search • Search query against protein database • Generate multiple alignment or profile • Use profile to search against PDB
Comparison of Whole Genomes • MUMmer (Salzberg group, 1999, 2002) • Pair-wise sequence alignment of genomes • Assume that sequences are closely related • Allow to detect repeats, inverse repeats, SNP • Domain inserted/deleted • Identify the exact matches • How it works • Identify the maximal unique match (MUM) in two genomes • As two genome are similar so larger MUM will be there • Sort the matches found in MUM and extract longest set of possible matches that occurs in same order (Ordered MUM) • Suffix tree was used to identify MUM • Close the gaps by SNPs, large inserts • Align region between MUMs by Smith-Waterman
Protein Structure Prediction • Experimental Techniques • X-ray Crystallography • NMR • Limitations of Current Experimental Techniques • Protein DataBank (PDB) -> 24000 protein structures • SwissProt -> 100,000 proteins • Non-Redudant (NR) -> 1,000,000 proteins • Importance of Structure Prediction • Fill gap between known sequence and structures • Protein Engg. To alter function of a protein • Rational Drug Design
Techniques of Structure Prediction • Computer simulation based on energy calculation • Based on physio-chemical principles • Thermodynamic equilibrium with a minimum free energy • Global minimum free energy of protein surface • Knowledge Based approaches • Homology Based Approach • Threading Protein Sequence • Hierarchical Methods
Energy Minimization Techniques Energy Minimization based methods in their pure form, make no priori assumptions and attempt to locate global minma. • Static Minimization Methods • Classical many potential-potential can be construted • Assume that atoms in protein is in static form • Problems(large number of variables & minima and validity of potentials) • Dynamical Minimization Methods • Motions of atoms also considered • Monte Carlo simulation (stochastics in nature, time is not cosider) • Molecular Dynamics (time, quantum mechanical, classical equ.) • Limitations • large number of degree of freedom,CPU power not adequate • Interaction potential is not good enough to model
Knowledge Based Approaches • Homology Modelling • Need homologues of known protein structure • Backbone modelling • Side chain modelling • Fail in absence of homology • Threading Based Methods • New way of fold recognition • Sequence is tried to fit in known structures • Motif recognition • Loop & Side chain modelling • Fail in absence of known example
Hierarcial Methods Intermidiate structures are predicted, instead of predicting tertiary structure of protein from amino acids sequence • Prediction of backbone structure • Secondary structure (helix, sheet,coil) • Beta Turn Prediction • Super-secondary structure • Tertiary structure prediction • Limitation Accuracy is only 75-80 % Only three state prediction
excitation scanning cDNA clones (probes) laser 2 laser 1 PCR product amplification purification emission printing mRNA target) overlay images and normalise 0.1nl/spot Hybridise target to microarray microarray analysis
Major Applications • Identification of differentially expressed genes in diseased tissues (in presence of drug) • Classification of differentially expressed (genes) or clustering/ grouping of genes having similar behaviour in different conditions • Use expression profile of known disease to diagnosis and classify of unknown genes
Stanford/cDNA chip one slide/experiment one spot 1 gene => one spot or few spots(replica) control: control spots control: two fluorescent dyes (Cy3/Cy5) Affymetrix/oligo chip one chip/experiment one probe/feature/cell 1 gene => many probes (20~25 mers) control: match and mismatch cells. Terms/Jargons
Pseudo-colour overlay Cy3 Cy5 Images : examples
Processing of images • Addressing or gridding • Assigning coordinates to each of the spots • Segmentation • Classification of pixels either as foreground or as background • Intensity determination for each spot • Foreground fluorescence intensity pairs (R, G) • Background intensities • Quality measures
Management of Microarray Data • Magnitude of Data • Experiments • 50 000 genes in human • 320 cell types • 2000 compunds • 3 times points • 2 concentrations • 2 replicates • Data Volume • 4*1011 data-points • 1015 = 1 petaB of Data
Management of Microarray Data Major Issues • Large volume of microarray data in last few years • Storage and efficient access • Comparison and integration of data • Problem of data access and exchange • Data scattered around Internet • Supplementary material of publications • Difficult for user to access relivent data • Problems with existing databases • Diverse purpose • Developed for specific purpose
Management of Microarray Data • Specific Database • Platform (eg.Stanford MA Database; SMD) • Organism (Yeast MA global viewer) • Project (Life cycle database of Drosophila) • Problem with Supplement and MA databases • Lack of direct access • Quality not checked • No standard format • Incomplete data
Pre-processed cDNA Gene Expression Data Slides On p genes for n slides: p is O(10,000), n is O(10-100), but growing, slide 1 slide 2 slide 3 slide 4 slide 5 … 1 0.46 0.30 0.80 1.51 0.90 ... 2 -0.10 0.49 0.24 0.06 0.46 ... 3 0.15 0.74 0.04 0.10 0.20 ... 4 -0.45 -1.03 -0.79 -0.56 -0.32 ... 5 -0.06 1.06 1.35 1.09 -1.09 ... Genes Gene expression level of gene 5 in slide 4 = Log2(Red intensity / Green intensity) These values are conventionally displayed on a red(>0)yellow (0)green (<0) scale.
Analysis of Microarray Data • Analysis of images • Preprocessing of gene expression data • Normalization of data • Subtraction of Background Noise • Global/local Normalization • House keeping genes (or same gene) • Expression in ratio (test/references) in log • Differential Gene expression • Repeats and calculate significance (t-test) • Significance of fold used statistical method • Clustering • Supervised/Unsupervised (Hierarchical, K-means, SOM) • Prediction or Supervised Machine Learnning (SVM)
Normalization Techniques • Global normalization • Divide channel value by means • Control spots • Common spots in both channels • House keeping genes • Ratio of intensity of same gene in two channel is used for correction • Iterative linear regression • Parametric nonlinear nomalization • log(CY3/CY5) vs log(CY5)) • Fitted log ratio – observed log ratio • General Non Linear Normalization • LOESS • curve between log(R/G) vs log(sqrt(R.G))
Classification • Task: assign objects to classes (groups) on the basis of measurements made on the objects • Unsupervised: classes unknown, want to discover them from the data (cluster analysis) • Supervised: classes are predefined, want to use a (training or learning) set of labeled objects to form a classifier for classification of future observations
Issues in Clustering • Pre-processing (Image analysis and Normalization) • Which genes (variables) are used • Which samples are used • Which distance measure is used • Which algorithm is applied • How to decide the number of clusters K
Unsupervised Learnning • Hierarchical clustering: merging two branches at the time until all vari-ables • (genes) are in one tree. [it does not answer the question of “how • many gene clusters there are”?] • K-mean clustering: assuming there are K clusters. [what if this assump-tion • is incorrect?] • Model-based clustering: the number of clusters is determined dynami-cally • [could be one of the most promising methods]
Supervised Analysis • Fisher’s linear discriminant analysis • Quadratic discriminant analysis • Logistic regression (a linear discriminant analysis) • Neural networks • Support vector machine
Traditional Proteomics • 1D gel electrophoresis (SDS-PAGE) • 2D gel electrophoresis • Protein Chips • Chips coated with proteins/Antibodies • large scale version of ELISA • Mass Spectrometry • MALDI: Mass fingerprinting • Electrospray and tandem mass spectrometry • Sequencing of Peptides (N->C) • Matching in Genome/Proteome Databases
Overview of 2D Gel • SDS-PAGE + Isoelectric focusing (IEF) • Gene Expression Studies • Medical Applications • Sample Experiments • Capturing and Analyzing Data • Image Acquistion • Image Sizing & Orientation • Spot Identification • Matching and Analysis
Comparision/Matcing of Gel Images • Compare 2 gel images • Set X and y axis • Overlap matching spots • Compare intensity of spots • Scan against database • Compare query gel with all gels • Calculate similarity score • Sort based on score
Normal Cells Disease Cells Differential Proteomics: Fingerprints of Disease • Phenotypic • Changes • Differential protein expression • Protein nitration patterns • Altered phosporylation • Altered glycosylation profiles • Utility • Target discovery • Disease pathways • Disease biomarkers
Fingerprinting Technique • What is fingerprinting • It is technique to create specific pattern for a given organism/person • To compare pattern of query and target object • To create Phylogenetic tree/classification based on pattern • Type of Fingerprinting • DNA Fingerprinting • Mass/peptide fingerprinting • Properties based (Toxicity, classification) • Domain/conserved pattern fingerprinting • Common Applications • Paternity and Maternity • Criminal Identification and Forensics • Personal Identification • Classification/Identification of organisms • Classification of cells
Fingerprinting Techniques: Principles & Applications • What is fingerprinting • Type of Fingerprinting • Common Applications Role of Computer in DNA Fingerprinting • Searching Restriction Enzymes • Searching VNTRs • Computation of size of DNA fragments • Optimization of gels • Comparison of patterns • Creation of Phylogenetic tree