Download
1 / 29
290 likes | 507 Vues
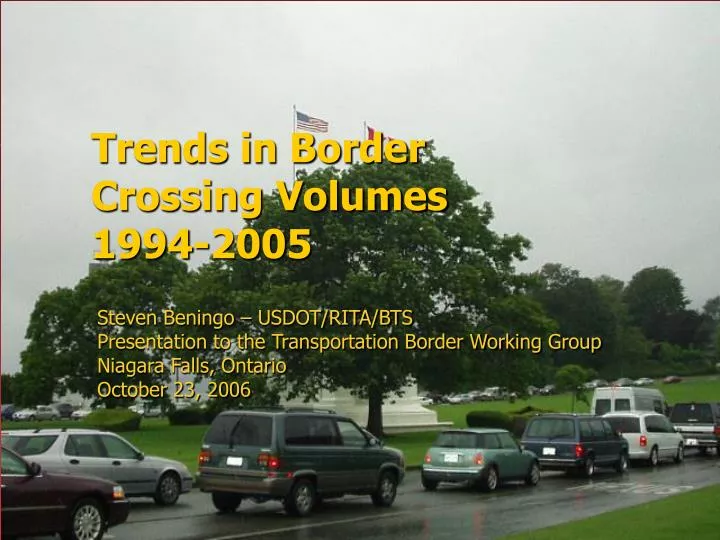
Trends in Border Crossing Volumes 1994-2005. Steven Beningo – USDOT/RITA/BTS Presentation to the Transportation Border Working Group Niagara Falls, Ontario October 23, 2006. Overview. RITA/BTS Border Crossing and Transborder Freight Data programs

E N D
Trends in Border Crossing Volumes 1994-2005 Steven Beningo – USDOT/RITA/BTS Presentation to the Transportation Border Working Group Niagara Falls, Ontario October 23, 2006
Overview • RITA/BTS Border Crossing and Transborder Freight Data programs • Changes in border traffic from 1994 to 2005 at: • The Niagara River Crossings • New York State Border Crossings • The entire U.S. – Canada Border
Border Crossing Data • Counts of inbound crossings to the United States from Canada and Mexico • Available monthly from October 1993 onward • On-line data from January 1995 onward • Data on: • Vehicles • Passengers • Containers • Pedestrians
Border Crossing Data Improvements • Now available in an online searchable database: www.bts.gov/itt • Users can search and download all historical data by: • State • Port • Mode • Year • Month
Transborder Freight Data • Transportation data for U.S. freight trade with Canada and Mexico by ALL modes of transportation • Detailed subset of official U.S. Trade Statistics • Available monthly from April 1994 onwards: www.bts.gov/itt • Data on NAFTA trade by: • Value • Weight • Mode • Commodity (two-digit HS) • Port of entry/exit • State/Province of origin and destination
Air and Vessel mode data added in 2004 Critical gaps filled beginning with 2007 statistics New data structure linking port and commodity detail Weight data on exports to Mexico for all modes Searchable database modernization underway(Target completion – Spring 2007) Multi-dimensional search tool will offer improved functionality over current searchable database Transborder Freight Data Improvements
Niagara River Crossings • Peace Bridge • Rainbow Bridge • Whirlpool Bridge (NEXUS only) • Lewiston-Queenston Bridge
Niagara River Crossings – Personal Vehicles2005 personal vehicle crossings were down 19% over 1994
Niagara River Crossings –Trucks2005 truck crossings were up 29% over 1994
Port of Buffalo-Niagara Falls – Value of Imports by Truck2005 value of imports by truck were up 37% over 1995
Port of Buffalo-Niagara Falls – Tonnage of Imports by Truck2005 tonnage of imports by truck were up 18% over 1995
Destination States for U.S. Imports by Truck Through Buffalo-Niagara Falls: 2005
Niagara River Crossings -Pedestrians2005 pedestrian crossings were up 4% over 1994, but down 55% over 2002
In 2005, pedestrian traffic on the Niagara River crossings (primarily the Rainbow Bridge) accounted for: 99.3% of all New York State Pedestrian Crossings 61.2% of all Pedestrian Crossings on the U.S. – Canada Border 0.8% of all Pedestrian Crossings into the United States Niagara River Crossings -Pedestrians
Niagara River Crossings -Buses2005 bus crossings were down 12% over 1994
Niagara River Crossings –Bus Passengers2005 bus passenger crossings were up 14% over 1994, but down 31% over 2000
Whirlpool Bridge2001-2006:80% Decrease in June Traffic NEXUS Implemented Source: Niagara Falls Bridge Commission
Niagara River Crossings –Other Crossing Trends • Trains and Train Passengers: • 2005 train crossings were down 17% over 1994 • 2005 train passenger crossings were down 22% over 1994 • Personal Vehicle Passengers: • 2005 personal vehicle passenger crossings were down 9% over 1995
New York State Border Crossings • Niagara River • St. Lawrence River • Land Border with Quebec Buffalo – Niagara Falls
New York State Border Crossing Personal Vehicle Traffic 2005 Compared to 1994 - Percentage Change in Personal Vehicle Volume: • Trout River/Fort Covington/Chateaugay: - 32% • Champlain/Rouses Point: - 29% • Buffalo-Niagara Falls: - 19% • Ogdensburg: - 15% • Alexandria Bay/Cape Vincent: - 8% • Massena: - 4%
Truck Traffic Entering New York State at the Border with Canada 2005 Compared to 1994 - Percentage Change in Truck Volume: • Ogdensburg: 122% • Champlain/Rouses Point: 42% • Trout River/Fort Covington/Chateaugay: 42% • Buffalo-Niagara Falls: 29% • Alexandria Bay/Cape Vincent: 22% • Massena: 5%
U.S. – Canada Border Crossings • Border Crossings in 11 States, 7 Provinces and the Yukon Territory • Top States – 2005 Personal Vehicles: • New York 9.1 million • Michigan 8.9 million • Washington 5.0 million • Maine 3.6 million • Vermont 1.4 million
U.S. – Canada Border Personal Vehicle Traffic: 2005 Compared to 1994 • Vehicle crossings into the U.S. fell from 40.3 million to 30.4 million (a 25% decline) • Personal vehicle traffic was down in all states • Only Grand Portage, Minnesota and Walhalla, North Dakota had more personal vehicle traffic in 2005 than 1994.
U.S. – Canada Border Truck Traffic: 2005 Compared to 1994 • Truck crossings into the United States increased from 5 million to 6.8 million (a 37% increase) • Top States – 2005 Trucks: • Michigan 2.7 million • New York 1.9 million • Washington 0.7 million • Maine 0.5 million • North Dakota 0.3 million
U.S. – Canada Border Truck Traffic: 2005 Compared to 1994 Incoming truck crossings up over 100% at: • Scobey, Montana (404%) • Boundary, Washington (192%) • Point Roberts, Washington (160%) • Lynden, Washington (154%) • Laurier, Washington (138%) • Ogdensburg, New York (122%) • Alcan, Alaska (121%) • Pinecreek, Minnesota (116%)
Key Points • Niagara River Crossings • More trucks • Fewer personal vehicles • More than half of all U.S. – Canada pedestrian crossings • Whirlpool Bridge volume decline • New York Border • More trucks • Fewer personal vehicles • Ogdensburg trucks more than doubled
Key Points • U.S. – Canada Border • More trucks • Fewer personal vehicles
Questions? Steven Beningo International Transportation Specialist Bureau of Transportation Statistics Research and Innovative Technology Administration U.S. Department of Transportation (202) 366-9683 steven.beningo@dot.gov