Download
1 / 74
900 likes | 1.52k Vues
Computational Proteomics and Metabolomics. Oliver Kohlbacher, Sven Nahnsen , Knut Reinert. 1 . Proteomics and Metabolomics. LU 1A – Introduction to PROTEOMICS and Metabolomics. Omics techniques and systems biology Difference between sequence-based techniques and MS-based techniques

E N D
Computational Proteomics and Metabolomics Oliver Kohlbacher, Sven Nahnsen, Knut Reinert 1. ProteomicsandMetabolomics
LU 1A – Introduction to PROTEOMICS and Metabolomics Omics techniques and systems biology Difference between sequence-based techniques and MS-based techniques Applications of proteomics, metabolomics, lipidomics
Systems Biology – Definition “Systems biologyis a relatively new biological study field that focuses on the systematic study of complex interactions in biological systems, thus using a new perspective (integration instead of reduction) to study them. Particularly from year 2000 onwards, the term is used widely in the biosciences, and in a variety of contexts. Because the scientific method has been used primarily toward reductionism, one of the goals of systems biology is to discover new emergentpropertiesthat may arise from the systemic view used by this discipline in order to understand better the entirety of processes that happen in a biological system.” http://en.wikipedia.org/wiki/Systems_biology (06/06/2008)
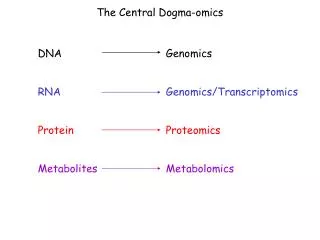
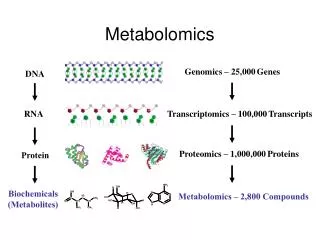
Technologies Genome Epigenome Transcriptome RNOme Proteome Interactome Metabolome Lipidome Mass Spectrometry Next-Generation Sequencing
Amplification • Sequencing-based methods have one massive advantage: DNA can be amplified • PCR(polymerase chain reaction) can exponentially amplify existing DNA fragments with a low error rate • 10 rounds of PCR increase the concentration of DNA in the sample by three orders of magnitude • Metabolites and proteins cannot be amplified • Methods for detecting and identifying metabolites and proteins thus need to be more sensitive
Omics Technologies http://en.wikipedia.org/wiki/File:Metabolomics_schema.png , accessed 2014-03-10, 11:42:00 UTC
LU 1B - Overview of separation techniques Overview separation techniques (GE, LC, GC) Chromatographic techniques Separation principles (size, isoelectric point, hydrophobicity)
Sample Preparation Methods • Samples for omics methods come from a wide range of sources: cell culture, primary tissue, body fluids • Extraction of the required biomolecules is often difficult • Cells need to be broken up (mechanically, with detergents) • Proteins need to be denatured • Enzyme inhibitors, e.g., protease and phosphatase inhibitors, avoid enzymatic degradation • Small molecules are extracted by precipitating larger molecules (proteins) using strong organic reagents (e.g., methanol) • Metabolomics sample preparation must be very fast, since metabolites (intermediates of metabolism) can be rapidly degraded • Different solvents are required to extract/precipitate metabolites/proteins • Buffers and reagents should be compatible with MS!
Separation Methods • Metabolomes and proteomes can be very complex (hundreds of thousands of analytes) • Analyzing them at the same time reduces sensitivity and comprehensiveness of the analysis • Idea: • Reduce the complexity • Split up the sample into smaller, less complex samples • Fractionation • Separation is done before the analysis and results in a (small) number of new samples (usually dozens) • Online separation • Separation happens simultaneously with the MS analysis
Overview Separation Methods • Protein separation methods • 1D-PAGE (Polyacrylamide Gel Electrophoresis) • 2D-PAGE • (Capillary Electrophoresis) • Peptide separation methods • Liquid chromatography • Isoelectric focusing of peptides • Metabolite separation methods • Liquid chromatography • Gas chromatography
Gel Electrophoresis – Principles • Primarily used to separate proteins and DNA • Proteins are charged (charge depends on pH, c.f. isoelectric point) • Migrate through a gel if an external electrostatic field is applied • Migration distance depends on charge (and/or size) http://pharmaexposure.blogspot.de/2011/06/gel-electrophoresis.html
Gel Electrophoresis • 1D-Polyacrylamide gel electrophoresis (PAGE) • Cut gel into slices • Analyze slices separately Senejaniet al.BMC Biochemistry.2001
Gel Electrophoresis • 2D-Polyacrylamide gel electrophoresis (PAGE) • Initial separation on a pH gradient, then second separation (orthogonal to the first) based on size • Excise single protein spots • Analyze the protein spots separately
Off-Gel Separation • Fractionation of peptides (or proteins) according to their pI) • Reduce sample complexity: mixture will be split into several fraction • Each fraction can be analyzed separately • Analytes are kept in solution (they are kept off the gel) Potential problems: • very basic or acidic peptides will not be captured • Measurement time is multiplied by the number of fractions • Protein quantification will have to include peptides from different fractions http://www.chem.agilent.com
Chromatography • Chromatography is a separation technique • From greekchroma and graphein – color and to write • Initially developed by Mikhail SemyonovichTsvet • Simple fundamental idea: • Two phases: stationary and mobile • Analytes are separated while mobile phase passes along the stationary phase • Various separation mechanisms, various choices for mobile/stationary phases possible M. S. Tsvet (1872-1919)
Column Chromatography http://fig.cox.miami.edu/~cmallery/255/255hist/ecbxp4x3_chrom.jpg
Chromatography • Liquid chromatography (LC) • Mobile phase liquid, stationary phase usually solid • Very versatile technique • High-Performance Liquid Chromatography (HPLC) for analytical purposes • Gas chromatography (GC) • Mobile phase is a gas passing over the solid phase • Usually at higher temperatures • Limited to volatile compounds • Others • Thin-Layer Chromatography (TLC) • Paper Chromatography (PC) • …
HPLC • High-performance liquid chromatography(HPLC) uses small columns (μm inner diameter) and very high pressure (600 bar) • Reversed-phase (RP) chromatography is the most common type: hydrophobic stationary phase, hydrophilic eluent (water/acetonitrile) as mobile phase • More hydrophobic analytes elute later than hydrophilic analytes detector pump column (stationary phase) mobile phase
Gas chromatography • Long column (10-200 m) • Column is operated at very high temperatures (up to 450 °C) • Requires analytes that are gaseous or evaporate easily • Derivatisation: Convertnon-volatile compounds to a volatile derivatives Injector Column oven Carrier gas http://de.wikipedia.org/wiki/Gaschromatographie
LU 1C - Introduction to Mass Spectrometry Definition of mass spectrometry, mass spectrum Overview of the three components of an MS (ion source, mass analyzer, detector) Molecular and atomic masses Isotope pattern/distribution, fine structure of isotope distribution
Mass Spectrometry • Definition:Mass spectrometry is an analytical techniqueidentifying type and amount of analytes present in a sample by measuring abundance and mass-to-charge ratio of analyte ions in the gas phase. • Mass spectrometry is often abbreviated mass spec or MS • The term mass spectroscopy is related, but its use is discouraged • Mass spectrometry can cover a wide range of analytes and usually has very high sensitivity
Mass Spectrometry – Early History • Wilhelm Wien was the first to separate charged particles with magnetic and electrostatic fields in 1899 • Sir Joseph J. Thomsonimproved on these designs • Sector mass spectrometers were used for separating uranium isotopes for the Manhattan project • In the 1950s and 1960s Hans Dehmeltand Wolfgang Paul developed the ion trap Wilhelm Wien (1864-1928) J.J. Thomson (1856-1940) http://www.nobelprize.org/nobel_prizes/physics/laureates/1911/wien.jpg http://en.wikipedia.org/wiki/J._J._Thomson#mediaviewer/File:J.J_Thomson.jpg
Int m/z + + + + + + + + + Components of a Mass Spectrometer mass spectrometer A mass spectrometer has three key components • Ion source – converting the analytes into charged ions • Analyzer– determining (and filtering by) mass-to-charge ratio • Detector– detecting the ions and determining their abundance ion source mass analyzer detector sample 2,200 x 900 x 2,900 x
Int m/z Combining LC and Mass Spectrometry • MS can be used as a very sensitive detector in chromatography • It can detect hundreds of compounds (metabolites/peptides) simultaneously • Coupling mass spectrometry to HPLC is then called HPLCS-MS (so-called ‘hyphenated technique’) • Idea:analytes elute off the column and enter the MS more or less directly mass spectrometer ion source mass analyzer detector
Key Ideas in MS • Ions are accelerated by electrostatic and electromagnetic fields • Neutral molecules are unaffected • Same idea: gel electrophoresis – but MS in vacuum/gas phase • Force acting into a charged particle is governed by Lorentz force: where • q is the charge of the particle, v is the velocity of the particle • E is the electric field, B is the magnetic field • F the force acting on the particle • Together with Newton’s second law of motion we see that the acceleration a of the particle relates to the mass-to-charge ratio m/q: • Acceleration of the ions is then used to determine m/q
Key Ideas in MS Acceleration: Example: • Applying the same electrostatic field E to different ions (e.g., different peptide ions) will result in a different acceleration, if they differ in the mass-to-charge ratio • An ion with the twice the mass, but the same charge, will thus experience half the acceleration – and will hit the detector later! E Ion Source Detector m a = q E / m 2 m a = q E / (2 m)
Molecular Mass and Atomic Mass • Atoms (and thus molecules) have a mass • Isotopes: all chemical elements have naturally occurring isotopes that have the same atomic number but different masses • Masses are generally given in units of kg (SI unit), however, there are a few conventions for atomic and molecular masses • Atomic mass is the rest mass of an atom in its ground state • Atomic mass is generally expressed in unified atomic mass units, which corresponds to 1/12 of the weight of 12C (1.6605402 x 10⁻²⁷ kg) • Commonly used is also the non-SI unit 1 Dalton [Da], which is equivalent to the unified atomic mass unit • Another deprecated unit equivalent to Da still found in literature is atomic mass unit (amu) IUPAC definition: doi:10.1351/goldbook.A00496
Molecular Mass • Mass of a molecule is the sum of the masses of its atoms • Accurate mass of a molecule is an experimentally determined mass • Exact mass of a molecule is a theoretically calculated mass of a molecule with a specified isotopic composition • Molecular weight or relative molecular mass is the ratio of a molecule’s mass to the unified atomic mass unit • For ions the mass of the missing/extra electron resp. proton needs to be included as well! Note: • Terms are not always used properly in the literature • Be cautious with masses you google somewhere • Reference: masses defined by IUPAC commission Murray et al., Pure Appl. Chem., Vol. 85, No. 7, pp. 1515–1609, 2013 http://www.iupac.org/home/about/members-and-committees/db/division-committee.html?tx_wfqbe_pi1%5bpublicid%5d=210
Isotopes • Isotopes are atom species of the same chemical element that have different masses • Same number of protons and electrons, but different number of neutrons • For proteomics: main elements occurring in proteins are C, H, N, O, P, S http://www.ciaaw.org/
Mass Number, Nominal, and Exact Mass • The mass number is the sum of protons and neutrons in a molecule or ion • The nominal mass of an ion or molecule is calculated using the most abundant isotope of each element rounded to the nearest integer • The exact mass of an ion or molecule is calculated by assuming a single isotope (most frequently the lightest one) for each atom • Exact mass is based on the (experimentally determined!) atomic masses for each isotope – numbers are regularly updated by IUPAC (International Union for Pure and Applied Chemistry) Example: Nominal mass of glycine (C2H5NO2): 2 x 12 + 5 x 1 + 14 x 1 + 16 x 2 = 75 Exact mass of glycine (C2H5NO2) using the lightest isotopes: 2 x 12.0 + 5 x 1.00782503226 + … = 75.0320284…
Monoisotopic Mass, Mass Defect • Monoisotopic mass of a molecule corresponds to the exact mass for the most abundant isotope of each element of the molecule/ion • Note that for small elements (e.g., C,H,N,O,S) the most abundant isotope is also the lightest one • Mass defect is the difference between the mass number and the monoisotopic mass • Mass excess is the negative mass defect Example Monoisotopic mass of glycine (C2H5NO2): 75.0320284… Nominal mass of glycine: 75 Mass excess of glycine: 0.0320284…
Average Mass • The average mass of a molecule is calculated using the average mass of each element weighted for its isotope abundance • These average masses (weighted by natural abundance) are also the masses tabulated in most periodic tables Example: Average mass of glycine (C2H5NO2): 2 x (0.9890 x M(12C) + 0.0110 x M(13C)) + 5 x (0.99985 x M(1H) + 0.00015 x M(2H)) + 1 x (0.09963 x M(14N) + 0.00037 x M(15N)) + 2 x (0.9976 x M(16O) + 0.00038 x M(17O) + 0.002 x M(18O)) = 75.0666 Da Simpler alternative: use average atomic weights from PTE!
Accurate Mass and Composition • Accurate mass is an experimentally determined mass of an ion or molecule and it can be used to determine the elemental formula • Accurate mass comes with a known accuracy or (relative) error, which is usually determined in ppm (10-6= parts per million) • Most mass spectrometers have a constant relative mass accuracy - absolute mass error often increases linearly with the measured mass Example:Measured accurate mass of valine (C5H11NO2): 117.077 Da Monoisotopic mass of valine: 117.078979 Da Absolute mass error: -0.0178979 Da Relative mass error: -0.0178979 Da/117.078979 Da = -16.9 ppm
IUPAC Terms IUPAC (International union of pure and applied chemistry) defines the meaning of all the terms – so if you are unsure, look them up in the IUPAC Gold Book and in the IUPAC recommendations: • Exact mass • Monoisotopic mass • Average mass • Mass number • Nominal mass • Mass defect • Mass excess • Accurate mass Murray et al., Pure Appl. Chem., Vol. 85, No. 7, pp. 1515–1609, 2013 http://goldbook.iupac.org/index.html
Isotope Patterns • Molecule with one carbon atom • Two possibilities: • light variant 12C • Heavy variant 13C • 98.9% of all atoms will be light • 1.1% will be heavy
Isotope Patterns • Molecule with 10 carbon atoms • Lightest variant contains only 12C • This is called ‘monoisotopic’ • Others contain 1-10 13C atoms, these are heavier by 1-10 Da than the monoisotopic one • In general, the relative intensities follow a binomial distribution, depending on the number of atoms • For higher masses (i.e., a larger number of atoms), the monoisotopic peak will be no longer the most likely variant
Isotope Patterns • It is possible to compute approximate isotope patterns for any given m/z, by estimating the average number of atoms • Heavier molecules have smaller monoisotopic peaks • In the limit, the distribution approaches a normal distribution
Online Calculator http://education.expasy.org/student_projects/isotopident/
Isotopic Fine Structure • High-resolution MS reveals isotopic finestructure (Why?) • -2 * 12C + 2 * 13C = 2.0068 Da/z shift • -12C+13C = 1.0034 Da/z shift • -14N+15N = 0.9971 Da/z shift
Computing the Isotopic Distribution • For simplicity’s sake, we will consider only nominal masses and no isotopic fine structure here • Let E be a chemical element (e.g. H or N). • Let πE[i] be the probability (i.e., natural abundance) of the isotope of E with i additional neutrons (i = 0 for the lightest isotope of E) • Relative intensities of pure E are given by (πE[0], πE[1], …πE[kE], where kE= nominal mass shift of heaviest isotope of E) • Given a molecule composed of two atoms of elements E and E’ • Probability for additional neutrons in the molecule is then the sum over all possible combinations and their respective probabilities
Computing the Isotopic Distribution • This is known as a convolutionand we can write with the convolution operator * • Convolution powersLet p1 := p and pn :- pn-1 * p for any isotope distribution p p0 with p0[0] = 1, p0[l] = 0 for l > 0 is the neutral element with respect to the operator * Example: Compute the isotope distribution of CO πCO[0] = πC[0]πO[0] πCO[1]= πC[1] πO[0] + πC[0] πO[1] πCO[2]= πC[2] πO[0] + πC[1] πO[1] + πC[0] πO[2]
Computing the Isotopic Distribution • The isotopic distribution for the chemical formula consisting of ni atoms of elements E1…El can be computed as • Runtime: quadratic in the number of atoms • Number of convolution operators is n1 + n2 + … nl – 1 and is thus linear in the number of atoms n • Convolution operator involves a summation for each π[i] • If the highest isotopic rank for E is kE, then the highest isotopic rank of Enis nkE – again, linear in the number of atoms • There are several tricks and practical considerations to speed up these calculations
LU 1D – Basic proteomic techniques and applications Definition and size of the proteome Protein databases Amino Acid masses, posttranslational modifications, protein isoforms Top-down proteomics Shotgun proteomics, tryptic digest Applications: clinical proteomics, signaling
Top-Down vs. Bottom-Up Proteomics • Two fundamentally different approaches in proteomics • Top-down proteomics: intact proteins are analyzed • Bottom-up proteomics (shotgun proteomics): proteins are digested to peptides, peptides are analyzed • Bottom-up approaches are currently more popular • Absolute mass error increases with measured mass to charge (m/z) value • Hard to determine mass for a protein – broad mass distribution • The sensitivity of mass measurements at a protein range is significantly worse than at peptide level • The existence of modifications complicates the analysis of complete proteins • Peptides are easier to separate using HPLC than proteins
Bottom-Up Proteomics • Note that bottom-up and shotgun proteomics are used equivalently most of the time • There are two conceptually different approaches in bottom-up proteomics Peptide mass fingerprinting Peptide sequencing • Peptide masses are used to identify the protein • Often used in combination with 2D gels • Peptides are fragmented • Fragments are used to interfere the sequence • Shotgun proteomics
G H P E T L E K A L E L H F R P A K A M D G N D I P V K E D F S L K A G A H K G H E K P D E M E T K L D S E K S A K K K L H Y Q V Q K L F E L L A G I M M D H G K V A G W V G A G G G Q V Q G H Y M P L D F G S G E F I L D G S G A E E E D A Q I W L A I G Q M L Q K S V N W A V S Q K L V G K L E M G V E G G Q F I P V K N L I S I Y F H K K K L K L R M I N E A A S D L E S L D E M E G E F L D A F Q A M L R K K G K K A G V A H L F D L F K K K L K T F S L W E G E H E Q H A V E A D V E A L G H G Q E V L I R T A D P Q H T S A K G D K F L S K V T E H A I A E L G H T H T P N H G A L Q S F E L Y ShotgunProteomics Key ideas • Separation of whole proteins possible but difficult, hence digestion preferred • Usually: trypsin – cuts after K and R and ensures peptides suitable for MS (positive charge at the end) • Separate peptides; this is easier than separating proteins • Identify proteins through peptides K digestion Separation Peptid- digest Proteins
Amino Acid Masses Note: these masses are for amino acid residues – HN-CHR-CO, not the full amino acid! It is thus the mass by which a protein mass increases, if this amino acid is inserted in the sequence.
Amino Acid Masses • Leu and Ile (L/I) are structural isomers • They thus have identical mass and cannot be distinguished by their mass alone! • Fragments with same mass are called isobaric • Gln and Lys (Q/K) have nearly identical masses: 128.09496 Da and 128.05858 Da • For low-resolution instruments they are indistinguishable, too Leu Ile
Post-Translational Modifications • Alterations to the chemical structure of proteins after the translation are called post-translational modifications (PTMs) • Chemical modifications (e.g., isotopic labels) are not PTMs • The UniMod database (www.unimod.org) contains a wide range of potential modifications to • PTMs play very important roles in cellular signaling • Best known example: phosphorylation • Phosphorylation of amino acids (primarily Ser, Thr, Tyr) can activate or inactivate protein function • Example: MAP kinase pathway