Download
1 / 42
420 likes | 587 Vues
Scalable data mining for functional genomics and metagenomics. Curtis Huttenhower 01-06- 10 11. Harvard School of Public Health Department of Biostatistics. What tools enable biological discoveries?. Our job is to create computational microscopes:

E N D
Scalable data mining for functional genomics and metagenomics Curtis Huttenhower 01-06-1011 Harvard School of Public Health Department of Biostatistics
What tools enable biological discoveries? Our job is to create computational microscopes: To ask and answer specific biomedical questions using millions of experimental results
Outline 2. Metagenomics: Modeling microbial communities for public health 1. Data mining: Integrating very large genomic data compendia
A computational definition offunctional genomics Prior knowledge Genomic data Gene ↓ Function Gene ↓ Gene Data ↓ Function Function ↓ Function
A framework for functional genomics 100Ms gene pairs → ← 1Ks datasets P(G2-G5|Data) = 0.85 Frequency Low Correlation High Correlation = + Frequency Not let. Let. Frequency Dissim. Similar Low Similarity High Similarity Low Correlation High Correlation
Functional networkprediction and analysis Global interaction network HEFalMp Currently includes data from30,000 human experimental results,15,000 expression conditions +15,000 diverse others, analyzed for200 biological functions and150 diseases Carbon metabolism network Extracellular signaling network Gut community network
Meta-analysis for unsupervisedfunctional data integration Huttenhower 2006Hibbs 2007 Evangelou 2007 Simple regression: All datasets are equally accurate Random effects: Variation within and among datasets and interactions
Meta-analysis for unsupervisedfunctional data integration Huttenhower 2006Hibbs 2007 Evangelou 2007 = +
Unsupervised data integration:TB virulence and ESX-1 secretion With Sarah Fortune Graphle http://huttenhower.sph.harvard.edu/graphle/
Unsupervised data integration:TB virulence and ESX-1 secretion With Sarah Fortune X ? Graphle http://huttenhower.sph.harvard.edu/graphle/
Outline 2. Metagenomics: Modeling microbial communities for public health 1. Data mining: Integrating very large genomic data compendia
What to do with your metagenome? Reservoir of gene and protein functional information Comprehensive snapshot of microbial ecology and evolution Who’s there? What are they doing? What do functional genomic data tell us about microbiomes? What can our microbiomes tell us about us?* (x1010) Public health tool monitoring population health and interactions Diagnostic or prognostic biomarker for host disease *Using terabases of sequence and thousands of experimental results
The Human Microbiome Project All healthy subjects; followup projects in psoriasis, Crohn’s, colitis, obesity, acne, cancer, antibiotic resistant infection… • 300 “normal” adults, 18-40 • 16S rDNA + WGS • 5 sites/18 samples + blood • Oral cavity: saliva, tongue, palate, buccal mucosa, gingiva, tonsils, throat, teeth • Skin: ears, inner elbows • Nasal cavity • Gut: stool • Vagina:introitus, mid, fornix • Reference genomes (~200+800) Kolenbrander, 2010 Hamady, 2009 2007 - ongoing
HMP Organisms: Everyone andeverywhere is different ← Body sites + individuals → gut nose mouth arm vagina ear mucosa palate gingiva tonsils saliva sub. plaq. sup. plaq. throat tongue ← Organisms (taxa) → Aerobicity, interaction with the immune system, and extracellular medium appear to be major determinants Every microbiome is surprisingly different Even common organisms vary tremendously in abundance among individuals There are few, if any, organismal biotypes in health Most organisms are rare in most places
HMP: Metabolic reconstruction Functional seq. KEGG + MetaCYC CAZy, TCDB,VFDB, MEROPS… 300 subjects 1-3 visits/subject ~6 body sites/visit 10-200M reads/sample 100bp reads BLAST Smoothing Witten-Bell BLAST → Genes Genes → Pathways MinPath(Ye 2009) WGS reads Genes(KOs) Taxonomic limitation Rem. paths in taxa < ave. ? Pathways(KEGGs) Pathways/modules Xipe Distinguish zero/low(Rodriguez-Mueller in review) Gap filling c(g) = max( c(g), median )
HMP: Metabolic reconstruction Pathway coverage Pathway abundance
HMP: Metabolic reconstruction Pathway abundance ← Samples → ← Pathways→
HMP: Metabolic reconstruction Pathway coverage ← Samples → All body sites (“core”) ← Pathways→ Aerobic body sites Gastrointestinal body sites
Metagenomic biomarker discovery Intervention/perturbation Healthy/IBD BMI Diet Biological story? Independent sample Batch effects? Populationstructure? Cross-validate Geneexpression Taxa &pathways SNPgenotypes Niches &Phylogeny Test forcorrelates Confounds/stratification/environment Featureselectionp >> n Multiplehypothesiscorrection
LEfSe: Metagenomic classcomparison and explanation LEfSe LDA +Effect Size Nicola Segata http://huttenhower.sph.harvard.edu/lefse
LEfSe: The TRUC murine colitis microbiota With Wendy Garrett
MetaHIT: The gut microbiome and IBD With Ramnik Xavier, Joshua Korzenik 124 subjects: 99 healthy 21 UC + 4 CD Taxa Qin 2010 PhymmBrady 2009 WGS reads ReBLASTed against KEGG since published data obfuscates read counts Genes(KOs) Pathways/modules Pathways(KEGGs)
MetaHIT: Taxonomic CD biomarkers Up in CD Down in CD Firmicutes UC Enterobacteriaceae
MetaHIT: Functional CD biomarkers Subset of enriched pathways in CD patients Subset of enriched modules in CD patients Up in CD Down in CD Growth/replication Motility Transporters Sugar metabolism
MetaHIT: Enzymes and metabolites over/under-enriched in the CD microbiome Up in CD Enzymefamilies Inferredmetabolites Growth/replication Motility Transporters Sugarmetabolism Down in CD
Outline • Network framework for scalable data integration • HEFalMp: human data integration • Meta-analysis for unsupervised functional network integration • HMP: microbiome in health, 18 body sites in 300 subjects • HUMAnN: metagenomic metabolic and functional pathway reconstruction • LEfSe: biologically relevant community differences 2. Metagenomics: Modeling microbial communities for public health 1. Data mining: Integrating very large genomic data compendia
Thanks! Human Microbiome Project George Weinstock Jennifer Wortman Owen White MakedonkaMitreva Erica Sodergren VivienBonazzi Jane Peterson Lita Proctor SaharAbubucker Yuzhen Ye Beltran Rodriguez-Mueller Jeremy Zucker QiandongZeng MathangiThiagarajan Brandi Cantarel Maria Rivera Barbara Methe Bill Klimke Daniel Haft Dirk Gevers Jacques Izard Nicola Segata PinakiSarder Ramnik Xavier HMP Metabolic Reconstruction Wendy Garrett Sarah Fortune Bruce Birren Mark Daly Doyle Ward Eric Alm Ashlee Earl Lisa Cosimi Levi Waldron LarisaMiropolsky Interested? We’re recruiting students and postdocs! http://huttenhower.sph.harvard.edu http://huttenhower.sph.harvard.edu/sleipnir
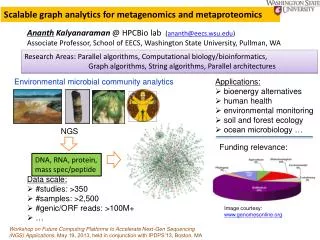
Functional network prediction from diverse microbial data 486 bacterial expression experiments 310 postprocessed datasets 304 normalized coexpression networks in 27 species 876 raw datasets 307 bacterial interaction experiments 114786 postprocessed interactions Integrated functional interaction networks in 15 species 154796 raw interactions E. Coli Integration ← Precision ↑, Recall ↓
Predicting gene function Predicted relationships between genes Low Confidence High Confidence Cell cycle genes
Predicting gene function Predicted relationships between genes Low Confidence High Confidence Cell cycle genes
Predicting gene function Predicted relationships between genes Low Confidence High Confidence These edges provide a measure of how likely a gene is to specifically participate in the process of interest. Cell cycle genes
Comprehensive validation of computational predictions With David Hess, Amy Caudy Genomic data Prior knowledge Computational Predictions of Gene Function SPELL Hibbs et al 2007 bioPIXIE Myers et al 2005 MEFIT Retraining Genes predicted to function in mitochondrion organization and biogenesis New known functions for correctly predicted genes Laboratory Experiments Growth curves Petite frequency Confocal microscopy
Evaluating the performance of computational predictions Genes involved in mitochondrion organization and biogenesis 106 Original GO Annotations 135 Under-annotations 82 Novel Confirmations, First Iteration 17 Novel Confirmations, Second Iteration 340 total: >3x previously known genes in ~5 person-months
Evaluating the performance of computational predictions Genes involved in mitochondrion organization and biogenesis Computational predictions from large collections of genomic data can be accurate despite incomplete or misleading gold standards, and they continue to improve as additional data are incorporated. 106 Original GO Annotations 95 Under-annotations 40 Confirmed Under-annotations 80 Novel Confirmations First Iteration 17 Novel Confirmations Second Iteration 340 total: >3x previously known genes in ~5 person-months
Functional mapping: mining integrated networks Predicted relationships between genes The strength of these relationships indicates how cohesive a process is. Low Confidence High Confidence Chemotaxis
Functional mapping: mining integrated networks Predicted relationships between genes Low Confidence High Confidence Chemotaxis
Functional mapping: mining integrated networks Predicted relationships between genes The strength of these relationships indicates how associated two processes are. Low Confidence High Confidence Chemotaxis Flagellar assembly
Functional mapping:Associations among processes HydrogenTransport ElectronTransport Edges Associations between processes Cellular Respiration Moderately Strong Very Strong Cell Redox Homeostasis Aldehyde Metabolism Protein Processing Peptide Metabolism Vacuolar Protein Catabolism Negative Regulation of Protein Metabolism Energy Reserve Metabolism Protein Depolymerization Organelle Fusion Organelle Inheritance
Functional mapping:Associations among processes HydrogenTransport ElectronTransport Edges Associations between processes Cellular Respiration Moderately Strong Very Strong Cell Redox Homeostasis Aldehyde Metabolism Protein Processing Peptide Metabolism Vacuolar Protein Catabolism Negative Regulation of Protein Metabolism Energy Reserve Metabolism Borders Data coverage of processes Protein Depolymerization Organelle Fusion Sparsely Covered Well Covered Organelle Inheritance
Functional mapping:Associations among processes HydrogenTransport ElectronTransport Edges Associations between processes Cellular Respiration Moderately Strong Very Strong Cell Redox Homeostasis Aldehyde Metabolism Nodes Cohesiveness of processes Protein Processing Peptide Metabolism Below Baseline Baseline (genomic background) Very Cohesive Vacuolar Protein Catabolism Negative Regulation of Protein Metabolism Energy Reserve Metabolism Borders Data coverage of processes Protein Depolymerization Organelle Fusion Sparsely Covered Well Covered Organelle Inheritance
Functional mapping:Associations among processes Edges Associations between processes Moderately Strong Very Strong Nodes Cohesiveness of processes Below Baseline Baseline (genomic background) Very Cohesive Borders Data coverage of processes Sparsely Covered Well Covered