Download
1 / 35
350 likes | 492 Vues
A new tool for fundamental niche modelling Renato De Giovanni Centro de Referência em Informação Ambiental, CrIA. openModeller. Scope and definition Fundamental niche modelling History of openModeller Motivation and features Architecture overview Interfaces and additional tools

E N D
A new tool for fundamental niche modelling Renato De Giovanni Centro de Referência em Informação Ambiental,CrIA
openModeller • Scope and definition • Fundamental niche modelling • History of openModeller • Motivation and features • Architecture overview • Interfaces and additional tools • Algorithms • Future plans
Definition openModeller is an open source C++ library completely dedicated to static spatial distribution modelling. Applications Biology: Fundamental niche modelling. Geology ? Demography ? Others ?
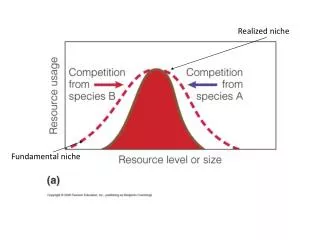
Temperature Precipitation Fundamental niche modelling Model creation step Occurrence points (geographical space) Occurrence points (environmental space) Environmental layers
Temperature Temperature Precipitation Precipitation Fundamental niche modelling Model creation step Occurrence points (environmental space) Distribution Model Algorithm
Temperature Precipitation Fundamental niche modelling Distribution map projection step Distribution Model Distribution map Algorithm Environmental layers
openModeller’s history apr 2003: Initial design of a new modelling environment at CRIA as a natural consequence of previous experiences with other tools (DesktopGarp). oct 2003: First working prototype as part of the speciesLink project (Fapesp). dec 2003: Released all source code (sourceforge). feb 2004: Partnership with BDWorld (CSM / GRID component). apr 2004: Partnership with University of Kansas (GARP / BTRA). jan 2005: Released first graphical user interface (Tim Sutton & Peter Brewer). may 2005: Basis of a new thematic project funded by Fapesp (4y).
Main Motivation Facilitate and speed up modelling tasks, offering at the same time a homogeneous environment to carry out experiments with different algorithms. Main features • Platform independent. • Enables the existence of multiple interfaces on top of it. • Accepts different formats of georeferenced maps. • Accepts different coordinate systems and projections for each map and for the whole set of occurrence points. • Accepts different cell sizes and extents for each map. • Allows the different algorithms to use exactly the same input and the same working environment, therefore enabling fair comparison between all results. • Isolates algorithm logic from other issues related to maps, georeferencing, input and output formats, etc. • Offers a collaborative and transparent environment for all interested developers.
pluggable algorithms interfaces Console API API GARP open Modeller Bioclim SOAP server CSM SWIG wrapper others... drivers (GDAL, proj4, etc) others... points maps (diff. formats) (diff. coord systems) Architecture overview
Interfaces and additional tools • Command line / Console suite • om_console • om_viewer (X11) • om_niche (X11) • SWIG wrapper • Python • SOAP interface (prototype server and sample client) • Web interface • Graphical User Interface (Linux, Windows, Mac OS)
Console interface >> om_console request.txt WKT Coord System = Species file = Species = Map = Mask = Output map = Output mask = Output format = Output file = Algorithm = Parameter =
Tool for visualizing maps >> om_viewer -r request.txt
Tool for visualizing models >> om_niche request.txt
Development of algorithms • Metadata definitions (name, version, author, description, bibliographic references, parameters). • Method to initialize the algorithm. • Method to generate the model. • Method to calculate the probability of occurrence given a certain vector of environmental values.
Algorithms: Building models Sampler gives the algorithm vectors of environmental values from a set of occurrence points: Ex: [20˚, 115 mm], [22˚, 100 mm] open Modeller Algorithm API Algorithm uses the values to build a distribution model and stores an internal representation of it.
Algorithms: Generating distribution maps For each cell of the resulting map, openModeller asks the probability of presence sending the vector of environmental values as a parameter. Ex: probability for [30˚, 90 mm] ? open Modeller Algorithm Algorithm answers with a probability of presence. Ex: prob = F( [30˚, 90 mm] ) = 0.8
Algorithms • Bioclim • Climate Space Model (Broken Stick cutoff method) • GARP (incl. best subset procedures) • Distance algorithms • Distance to average • Minimum distance
Algorithms - Bioclim • Assumes normal distribution for each environmental variable. • Envelopes are represented by the interval [m - c*s, m + c*s], where 'm' is the mean; 'c' is the cutoff parameter; and 's' is the standard deviation. • Besides the envelope, each environmental variable has additional upper and lower limits taken from the maximum and minimum values related to the set of occurrence points. • Points are classified as: suitable, marginal or unsuitable. fig. 2: cutoff = 0.99 fig. 1: cutoff = 0.674
Algorithms - GARP • Genetic Algorithm for Rule-set Production: models are represented by a set of rules generated by a genetic algorithm. • Non-deterministic: produces a different model each time the algorithm is run. fig. 1: model 1 fig. 2: model 2 fig. 3: model 3
Algorithms – GARP with Best subsets procedure • Runs several GARP models and chooses the best ones according to omission and commission errors. • Resulting model is the overlapping of models that were selected in the previous step. fig. 1: sample model
Algorithms – distance to average • Normalizes environmental values and parameter. • Calculates the mean point in environmental space considering all presence points. • Probabily of presence is proportional to the Euclidean distance from the average point (linear decay). • Parameter determines the maximum accepted distance. fig. 1: parameter = 0.1 fig. 2: parameter = 0.3
Algorithms – Minimum distance • Normalizes environmental values and parameter. • Probabily of presence is proportional to the Euclidean distance from the closest point (linear decay). • Parameter determines the maximum accepted distance. fig. 1: parameter = 0.05 fig. 2: parameter = 0.1
Use case – Byrsonima subterranea Brad. & Markgr. = original point = 4 new points
Scope issues & known limitations • Works only with static models – dynamic modelling is currently outside the scope of this tool. • None of the algorithms can handle categorical maps (although the library is already prepared to deal with them). • None of the algorithms can handle absence points (except GARP), and none of the high level interfaces is prepared to receive absence points as an additional parameter. • Works only with latitude & longitude – not prepared to produce models considering three dimensions. • Needs more documentation.
Future plans • Implementation of other algorithms: neural nets, cellular automata, GLM, GAM, GRASP, Domain, Maximum entropy… • Development of new components to help on pre-processing and post-analysis. • Finalize Web and SOAP interfaces. • Develop SWIG interfaces for other programming languages. • Produce more documentation. • Implementation of a new and advanced graphical user interface.
Institutions & People Mauro Muñoz, Marinez F. Siqueira, Sidnei de Souza, Renato De Giovanni Rubens R. Fonseca, Fabiana Santana, and others Lúbia Vinhas, Alexandre C. Jardim and others Tim Sutton, Peter Brewer Ricardo S. Pereira, Kevin Ruland Jens Oberender, Tom Elwertowsky Voluntary work
Thank you http:// openmodeller . sf . net renato (at) cria . org . br