Download
1 / 15
180 likes | 370 Vues
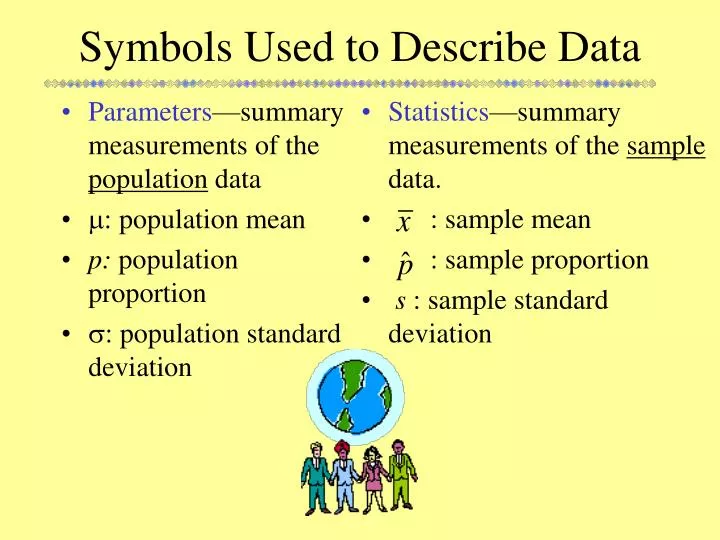
Parameters —summary measurements of the population data : population mean p: population proportion : population standard deviation. Statistics —summary measurements of the sample data. : sample mean : sample proportion s : sample standard deviation.

E N D
Parameters—summary measurements of the population data : population mean p: population proportion : population standard deviation Statistics—summary measurements of the sample data. : sample mean : sample proportion s : sample standard deviation Symbols Used to Describe Data
Measures of Center Mean(, ) —add up data values and divide by number of data values Median (M)—list data values in order, locate middle data value; average middle 2 if necessary Data Set: 19, 20, 20, 21, 22 Mean = 20.4; Median = 20 Data Set: 19, 20, 20, 21, 38 Mean = 23.6; Median = 20
Robust (Resistant) Statistic • Robust or resistant: value doesn’t change dramatically when extreme values, like outliers, are added to (or taken out of) the data set. • Median is resistant, so it is used to state the “typical” value • Mean is NOT resistant against extreme values. Mean is pulled away from the center of the distribution toward the extreme value (“tails of graph”).
Symmetric Skewed to the left Skewed to the right Measures of Center on Different Distribution Shapes In each of the graphs, decide which mark represents the mean µ, median M, and mode Mo. Remember the mean is pulled toward extreme values. µ, M, Mo all = Mo, M, µ
Describing Spread: Range, IQR, Standard Deviation, & Variance • Range: Max – Min • IQR: Q3 – Q1 • Standard deviation(, s): the average distance values fall from the mean • Variance: standard deviation squared
Population and SampleStandard Deviation Variance is 2 (or s2) and is another measure of spread, but in square units If data is in your calculator, press Stat, Calc, 1-Var stats and the Sx is the standard deviation
Computing & Interpreting Standard Deviation • Sample data set: 72, 88, 96, 100 = 89 Sum = 460 Interpretation: On average, the individual data values are about 12 units away from the mean.
Calculated Standard Deviationis a measure of Variation in data Symmetric, (One bar) 0 100 Symmetric 10 100 100 Symmetric 50 142 99.85 Skewed
Which measures of center and spread do I use when describing a distribution? • When the sampling distribution is bell shaped and symmetrically distributed, use the mean as the measurement for center and standard deviation as the measure for spread. • When the sampling distribution is unknown or skewed use the median as the measurement for center and the IQR &/or range as the measure for spread.
Reading Computer Output • What type of graph could be made with the given information? • Boxplot using the 5 number summary • Determine if there are any outliers or not. • 1.5(IQR) = 39.99; • 19.06 - 39.99 = -20.93; 45.72 + 39.99 = 85.71 • Outliers would be < -20.94 or >85.71 • Since max is 93.34, it is an outlier • Not known where right whisker would end, but somewhere between Q3 and 85.71
How are measures of center and spread effected by conversions? • Suppose we have a data set: 2,5,7,8,9 • If we add 5 to each number in the data set, • what will happen to the mean and median? • They will increase by 5, since everything is shifted up • what will happen to the range/IQR/st dev.? • They will stay the same, since the spread of the data remains the same
Data set:2,5,7,8,9 • If we multiply each number by 2, • What will happen to the mean and median? • They will also multiply by 2, because they all double • What will happen to the range/IQR/st dev.? • They will also multiply by 2, since the spread gets magnified as well. • What will happen to the variance? • It will be multiplied by 22, or 4, since the variance is a squared measure.
When data is converted: • Measures of center are effected by all operations • Do to the mean and median what you do to the data • Measures of spread are only effected by multiplication (and division). • Addition/subtraction does not change spread!
Example The mean height of a class of 15 children is 48 inches, the median is 45 inches, the standard deviation is 2.4 inches, and the IQR is 3 inches. Find the mean, median,standard deviation, and IQR if: • you convert each height to feet • Divide data by 12, so divide everything by 12 • Mean = 4, median = 3.75, sd = 0.2, IQR = 0.25 (all in feet) • each child grows 2 inches • Add 2 to data, so add 2 to measures of center only • Mean = 50, median = 47, sd = 2.4, IQR = 3 (all in inches) • each child grows 2 inches and you convert the height to feet • Add 2 then divide by 12 to data, so add 2 to measures of center then divide everything by 12 • Mean = 4.17, median = 3.92, sd = 0.2, IQR = 0.25 (all in feet)