Download
1 / 48
490 likes | 613 Vues
The Future of the U.S. Refining Industry Why Climate Legislation is (more) Bad News for the Refining Sector Presentation by Lucian Pugliaresi Energy Policy Research Foundation, Inc. Washington, DC before New York Energy Forum New York City February 22 , 2010.

E N D
The Future of the U.S. Refining IndustryWhy Climate Legislation is (more) Bad News for the Refining Sector Presentation by Lucian PugliaresiEnergy Policy Research Foundation, Inc. Washington, DC before New York Energy ForumNew York CityFebruary 22, 2010 Energy Policy Research Foundation, Inc. | 1031 31st St, NW Washington, DC 20007 | 202.944.3339 | www.eprinc.org
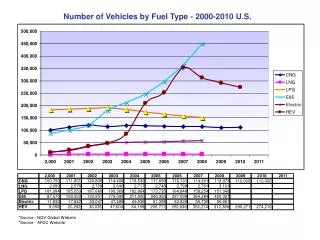
Number of U.S. Refineries and Capacity Source: EIA data
Total Gasoline Imports Share of Finished Motor Gasoline Product Supplied Source: EIA data, EPRINC calculations
US Refinery Capacity Utilization1985-2009 Source: EIA data, EPRINC Calculations
Compliance Costs: US Refining Industry Red area above yellow line represents “free” allowances allocated to refiners
Effective Cost of Production: US Product Slate Source: EPRINC Calculations from OGJ and proprietary refinery data sets of complexity, product slate valuations, and location. Product slate standardized to common EPRINC product/cost value index.
U.S. Refiners' Future Cost of Production (2015 - 2030) Source: EPRINC report:The American Clean Energy and Security Act: An EPRINC Assessment of Capacity and Employment Losses in the Domestic Refining Industry . Energy Policy Research Foundation, Inc. | 1031 31st St, NW Washington, DC 20007 | 202.944.3339 | www.eprinc.org
Stationary Emission Costs and Potential Capacity Losses2015-2030 Source: EPRINC report:The American Clean Energy and Security Act: An EPRINC Assessment of Capacity and Employment Losses in the Domestic Refining Industry .
Product Combustion Pass-Through Costs and Potential Capacity Losses - 2015-2030 Source: EPRINC report:The American Clean Energy and Security Act: An EPRINC Assessment of Capacity and Employment Losses in the Domestic Refining Industry .
Emission Allowances for Refiners Under W-M (Millions of Metric Tons of CO2 per Annum) Source: EPRINC report:The American Clean Energy and Security Act: An EPRINC Assessment of Capacity and Employment Losses in the Domestic Refining Industry .
Annual Compliance Cost for U.S. Refiners Under W-M (U.S. dollars in billions, carbon prices derived from EPA estimates) Source: EPRINC report:The American Clean Energy and Security Act: An EPRINC Assessment of Capacity and Employment Losses in the Domestic Refining Industry .
EPA and EIA Allowance Price Forecasts Source: EPA and EIA Forecasts
U.S. Distillate Net Imports Source: EIA Data
Projected Worldwide Refining Capacity Additions Source: IEA Forcasts, EPRINC Calculations
Some Planned Refining Capacity Additions by Locations Source: EPRINC Calculations
Refined Product Gross Margins Source: EIA Data, EPRINC Calculations
Stationary Emissions not Covered by Free Allowances Source: EIA Data, EPRINC Calculations
EISA ’07 Renewable Fuels Standard Source: DOE, EIA Data and June 2009 STEO. Blend wall assumes projected 2009 gasoline consumption found in the June 2009 EIA STEO. Energy Policy Research Foundation, Inc. | 1031 31st St, NW Washington, DC 20007 | 202.944.3339 | www.eprinc.org
Retail Fuel Prices *Price is per gallon of gasoline equivalent (BTU basis), according to DOE conversion standards: 1 Gallon of Gasoline = 1.333 gallons of E85 and 0.904 gallons of diesel. Source: DOE Data Energy Policy Research Foundation, Inc. | 1031 31st St, NW Washington, DC 20007 | 202.944.3339 | www.eprinc.org
Energy Subsidies Not Related to Electricity Production Energy Policy Research Foundation, Inc. | 1031 31st St, NW Washington, DC 20007 | 202.944.3339 | www.eprinc.org
Ethanol Subsidies Energy Policy Research Foundation, Inc. | 1031 31st St, NW Washington, DC 20007 | 202.944.3339 | www.eprinc.org
FFVs and E85 Usage Source: EIA Data, DOE Data, EPRINC Calculations Energy Policy Research Foundation, Inc. | 1031 31st St, NW Washington, DC 20007 | 202.944.3339 | www.eprinc.org
EIA AEO 2010 Biofuels Projection • “Biofuels grow, but fall short of the 36 billion gallon RFS target in 2022, exceed it in 2035.” • Richard Newell, EIA, at SAIS, December, 2009 Energy Policy Research Foundation, Inc. | 1031 31st St, NW Washington, DC 20007 | 202.944.3339 | www.eprinc.org
Cost and Effectiveness of Cash for Guzzlers Program Energy Policy Research Foundation, Inc. | 1031 31st St, NW Washington, DC 20007 | 202.944.3339 | www.eprinc.org 25
The RFS Already Maximizes U.S. Low-GHG Biofuel Use Through 2025 • The 2008 AEO & a 2008 DOE Policy Analysis Office study project that RFS2 cellulosic biofuel waivers will be required through 2030 (AEO) or 2025 (Policy Analysis Office). Since then, the recession has further delayed investment. Energy Policy Research Foundation, Inc. | 1031 31st St, NW Washington, DC 20007 | 202.944.3339 | www.eprinc.org
EIA W-M Base Case Petroleum Demand Source: EIA Forecasts Energy Policy Research Foundation, Inc. | 1031 31st St, NW Washington, DC 20007 | 202.944.3339 | www.eprinc.org
Energy Policy Research Foundation, Inc. | 1031 31st St, NW Washington, DC 20007 | 202.944.3339 | www.eprinc.org 28
Product Prices and Share Source: EIA Data, CME Group, EPRINC Calculations. All prices are for front month futures contracts. Prices are not BTU adjusted. Energy Policy Research Foundation, Inc. | 1031 31st St, NW Washington, DC 20007 | 202.944.3339 | www.eprinc.org
Lifecycle GHG Emissions Source: EPA, http://www.epa.gov/OMS/renewablefuels/420f09024.htm Energy Policy Research Foundation, Inc. | 1031 31st St, NW Washington, DC 20007 | 202.944.3339 | www.eprinc.org
Energy Policy Research Foundation, Inc. | 1031 31st St, NW Washington, DC 20007 | 202.944.3339 | www.eprinc.org
Energy Policy Research Foundation, Inc. | 1031 31st St, NW Washington, DC 20007 | 202.944.3339 | www.eprinc.org
A Selection of Ethanol Subsidies Energy Policy Research Foundation, Inc. | 1031 31st St, NW Washington, DC 20007 | 202.944.3339 | www.eprinc.org
Ethanol Subsidies Energy Policy Research Foundation, Inc. | 1031 31st St, NW Washington, DC 20007 | 202.944.3339 | www.eprinc.org
GHG Well to Wheels – CA ULSD Source: Detailed California-Modified GREET Pathway for Ultra Low Sulfur Diesel (ULSD) from Average Crude Refined in California, CARB, Feb 28 2009 Energy Policy Research Foundation, Inc. | 1031 31st St, NW Washington, DC 20007 | 202.944.3339 | www.eprinc.org
Upstream GHG Emissions by Feedstock Source: “An Evaluation of the Extraction, Transport and Refining of Imported Crude Oils and the Impact on Life Cycle Greenhouse Gas Emissions”, DOE/NETL-2009/1362, March 27, 2009 Energy Policy Research Foundation, Inc. | 1031 31st St, NW Washington, DC 20007 | 202.944.3339 | www.eprinc.org
How the LCFS is Met in 2030 Approx. 275 million tonnes of CO2 equivalent credits are required by 2030. Energy Policy Research Foundation, Inc. | 1031 31st St, NW Washington, DC 20007 | 202.944.3339 | www.eprinc.org
Alberta Oil Sands – With and Without LCFS Reference case 2025 LCFS case 2025 0.6 mbpd 0.7 mbpd 3.4 mbpd 2.0 mbpd 1.2 mbpd Source: “An Evaluation of the Extraction, Transport and Refining of Imported Crude Oils and the Impact on Life Cycle Greenhouse Gas Emissions”, DOE/NETL-2009/1362, March 27, 2009 Energy Policy Research Foundation, Inc. | 1031 31st St, NW Washington, DC 20007 | 202.944.3339 | www.eprinc.org
Impact of U.S. LCFS on CO2 Emissions Note: US LCFS limits leads to significant reductions in emissions attributed to the LCFS, but these reductions are largely offset by increased emissions in the rest of the world: Canadian oil sands go elsewhere & most increased biofuel use is at the expense of biofuel use elsewhere. Source: US DOE, Unofficial estimates of LCFS, private communication. Energy Policy Research Foundation, Inc. | 1031 31st St, NW Washington, DC 20007 | 202.944.3339 | www.eprinc.org 39
The Endangerment Finding Greenhouse Gas Emission Regulation Under the Clean Air Act December 2009 Energy Policy Research Foundation, Inc. | 1031 31st St, NW Washington, DC 20007 | 202.944.3339 | www.eprinc.org
Pathways for Control of GHGs • Clean Air Act (CAA) – emission limitations on stationary and mobile sources, including fuels • Endangered Species Act (ESA) – emission sources could be subject to consultation requirements and “takings” claims for effects on specie habitat • Clean Water Act (CWA) – limits could be placed on GHG emissions to address ocean acidification and water temperature changes • National Environment Policy Act (NEPA) – could require the analysis of climate change in environmental assessments and impact statements Energy Policy Research Foundation, Inc. | 1031 31st St, NW Washington, DC 20007 | 202.944.3339 | www.eprinc.org
What are Prospects for Legislative Preemption? None of the legislative proposals before Congress call for full preemption of CAA stationary and mobile source requirements HR 2454 preempts some stationary sources requirements but not fuels S. 1733 is similar to HR 2454 but has 25k source threshold for PSD and Title V None of the legislative proposals preempt CWA and ESA requirements or tort. Only limited State preemption Worse outcome is legislation and regulation ̶ 60 votes for full preemption may be difficult Energy Policy Research Foundation, Inc. | 1031 31st St, NW Washington, DC 20007 | 202.944.3339 | www.eprinc.org
Preliminary Conclusions Multiple Regulatory Pathways under which Petroleum facilities could be regulated. Clean Air Act (CAA) – not well suited to regulating GHGs Pathways are linked; regulation under one CAA provision can and will trigger regulation under others. Litigation, including citizen suits, will increase dramatically but unlikely to stay rules. Managing the regulation of GHGs likely to be a key objective for industry. Energy Policy Research Foundation, Inc. | 1031 31st St, NW Washington, DC 20007 | 202.944.3339 | www.eprinc.org
Petroleum Emission Sources Energy Policy Research Foundation, Inc. | 1031 31st St, NW Washington, DC 20007 | 202.944.3339 | www.eprinc.org
Final Endangerment Finding: Second Order Effects are Numerous • Two major findings: • Current and projected atmospheric concentrations of 6 GHGs endanger public health and welfare; • Combined emissions of 4 of the 6 pollutants emitted from motor vehicles contribute to atmospheric concentrations and threat. • Final Endangerment Finding will likely compel regulation under several other provisions of CAA that rely on similar endangerment test Energy Policy Research Foundation, Inc. | 1031 31st St, NW Washington, DC 20007 | 202.944.3339 | www.eprinc.org
Stationary and Mobile Controls Will Be Triggered Early Next Year • March 2010 – • Final Endangerment Finding – will allow EPA to finalize its GHGs motor vehicle rule • Final Motor Vehicle Rule – will make CO2 and other GHGs a “regulated pollutant” under the CAA. • Even though EPA will regulate cars, EPA states that the motor vehicle rule will immediately trigger (without further rulemaking) stationary source requirements: • Operating Title V permit requirements • for plants or buildings having potential to emit > threshold limit • Plant modification pre-construction permit requirements and best available controls (“PSD/BACT”) • For existing plants with emissions ≥ threshold limits that make modifications that increase GHG emissions Energy Policy Research Foundation, Inc. | 1031 31st St, NW Washington, DC 20007 | 202.944.3339 | www.eprinc.org
What Would National GHG NAAQSLook Like* • National Ambient Air Quality Standard (NAAQS) ̶endangerment test similar to§202 finding. • Expect litigation ̶CBD petition to set 350 ppm GHG NAAQS. • Similar to ozone and PM2.5 – standard could force all areas of country to be considered in attainment or non-attainment. • Given tough statutory consequences for non-attainment – LAER, offsets for all emission increases and 10-year attainment deadline – EPA likely to place all areas into attainment. • EPA could then require states to develop maintenance strategies – reductions to assure concentrations are not exceeded. • Challenge of attaining concentration levels that will be driven by international emissions. *If not preempted by legislation
Political Factors Affecting Regulatory Outcomes • New Administration • Eager to right perceived wrongs • Moving at breakneck speed to issue new rules • Some recognition that speed is necessary to prevent unraveling if one-term Presidency • Top-down management style – career staff frustrated • Few moderating influences inside the Administration • One year from now things could change -- • Mid-term election coupled with lackluster economic growth and job creation could slow EPA regulatory march • Significant regulatory activity on non-GHGs could overwhelm States and sources • Top-down management strategy could yield to more staff reality checks and greater interagency push back Energy Policy Research Foundation, Inc. | 1031 31st St, NW Washington, DC 20007 | 202.944.3339 | www.eprinc.org