Download
1 / 16
160 likes | 289 Vues
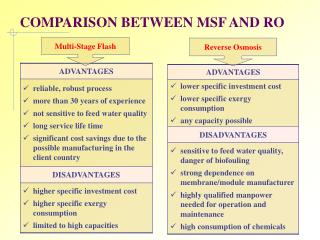
Comparison between Census and WIPR data. Date: 21 September 2004. CDR. Objectives. To provide some background to the projections To illustrate why an evaluation of the Markdata projections and the Census is necessary To provide a summary of the challenges and the methodology

E N D
Comparison between Census and WIPR data Date: 21 September 2004 CDR
Objectives • To provide some background to the projections • To illustrate why an evaluation of the Markdata projections and the Census is necessary • To provide a summary of the challenges and the methodology • To report on progress thus far • To sketch a possible way forward
Background? • The Department needs to plan water resources and water consumption is partly depend on population growth. • Markdata was commissioned in 1995 to undertake a set of projections to establish potential water demand over time. • Geographical areas covered • Magisterial Districts • Water Consumption Centres • At that time census 1996 data were unavailable. • Base data for this set of projections consisted of “triangulation” between various sources (1991 census data, projected data and Markdata Surveys). • The 1970 census was also used to inform the base data as this was the last census that covered the whole of South Africa.
Background? • Various population and economic variables: • Population growth for the period 1991-1996 • Major indicators of economic growth • Net migration during 1996 • Indicators of employment and • Household income during 1996 and • Gross Geographic Product • informed future growth potential and individual forecasts was undertaken for each Magisterial District and Consumption Centre up to 2025. • The purpose of this project would therefore be to assess whether these projections compare favourably to the 2001 census results. • Boundary changes and migration result in differences at smaller geographical levels especially magisterial district and placenames
Why ? • Why do we need to compare the projections to the census data ? • Change over time in demographic trends and in the structure of the economy. • Most projections rest on assumptions and these assumptions may not hold true for long periods of time. Recent trends are, for instance: • Any uncertainties associated with an illness such as HIV/AIDS and interventions such as the use of ART - impact difficult to assess. • Slight errors in the data may be compounded and could deviate majorly in twenty years time
Why ? • The latter could also be illustrated by the following: • At national and provincial level the IWRP data did not differ significantly, but the question remained whether there would be significant differences at magisterial level.
Data Challenges ? • Differences in the coding system between the 1996 and 2001 census • Differences in the 2001 Spatial data and the 2001 Alpha-numeric data because of cross-boundary demarcation
Data Challenges ? • Code and name differences worse at the placename level
Methodology • Three data sets were integrated into one: • Population census1996 • Population census 2001 • IWRP Data • Sorted coding and naming problems and performed data checks • IWRP data projections obtained for 1995, 2005 and 2015. • Projected estimates derived for 1996 and 2001 by interpolating. • Preliminary comparisons performed using adjusted estimates • Difference measured using the numbers and ratios • Aggregated to National level • Provincial level and • Magisterial District
Difference per province (2001) • Larger differences possibly mainly attributable to migration
Preliminary Results • Preliminary analysis indicate a relatively small difference in population size. • Deviations in 15% of the cases probably still need to be determined since likelihood for larger or smaller population has not yet been established. • In approximately 5% of the magisterial districts differences would be as a result of the boundary problems.
Way Forward • Investigate the reasons for differences. • Refine the analysis. • The census has not been tested for undercount yet. • This analysis will inform the next steps where the various components for a changing population need to be investigated looking at fertility, migration, mortality and other factors, etc. • The placename data need to be integrated to enable a comparison between urban population in the IWRP data. • Household growth expected to play a significant role in water consumption.
Thank you Sample table slide