Download
1 / 24
240 likes | 484 Vues
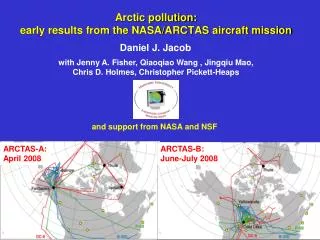
SOURCES OF POLLUTION TO THE ARCTIC: INSIGHTS FROM ARCTAS AND SATELLITE OBSERVATIONS. Daniel J. Jacob, Harvard University ARCTAS Mission Scientist. ARCTIC RESEARCH OF THE COMPOSITION OF THE TROPOSPHERE FROM AIRCRAFT AND SATELLITES (ARCTAS).

E N D
SOURCES OF POLLUTION TO THE ARCTIC:INSIGHTS FROM ARCTAS AND SATELLITE OBSERVATIONS Daniel J. Jacob, Harvard University ARCTAS Mission Scientist
ARCTIC RESEARCH OF THE COMPOSITION OF THE TROPOSPHERE FROM AIRCRAFT AND SATELLITES (ARCTAS) A NASA contribution to IPY and the international POLARCAT initiative focused on four scientific themes: 1. Long-range transport of pollution to the Arctic(arctic haze, tropospheric ozone, mercury) 2. Boreal forest fires(implications for atmospheric composition and climate) 3. Aerosol radiative forcing(from arctic haze, boreal fires, surface-deposited black carbon, and other perturbations) 4. Chemical processes(with focus on radical chemistry and implications for ozone, aerosols, mercury) NASA DC-8 NASA Satellite A-Train NASA P-3B NASA B-200 Spring deployment, 1-20 April 2008: Fairbanks and Barrow Summer deployment, 26 June – 13 July 2008: Cold Lake (Alberta) and Yellowknife
ARCTAS Field Campaign Strategy: Maximize the value of satellite data for improving models of atmospheric composition and climate Satellite instruments: CALIOP, GOME-2, IASI, OMI, TES, MLS, SCIAMACHY, MODIS, MISR, MOPITT, AIRS • Aerosol optical depth, properties • H2O, CO, methane, ozone, NO2, HCHO, SO2, BrO Calibration and Validation Retrieval development Correlative information Small scale structure and processes Aircraft: DC-8, P-3B, B200 • Comprehensive in situ chemical and aerosol • measurements • Active remote sensing of ozone, water vapor • and aerosol optical properties • Passive radiance measurements Error characterization Data assimilation Diagnostic studies Models: CTMs, GCMs, ESMs • Source-receptor relationships for pollution • Inverse modeling for estimating emissions • Aerosol radiative forcing • Detailed chemical processing
ARCTAS PLATFORMS DC-8 P-3B B-200 Chemistry and Aerosols Radiation and Aerosols Aerosol satellite validation 9 Instruments HSRL – CALIPSO RSP – GLORY 21 instruments Supporting teams in the field: Satellites: CALIPSO, MODIS, TES, OMI, AIRS, MISR, MOPITT Model forecasts/analyses: GEOS-5, GOCART, GEOS-Chem, STEM, MOZART, LaRC Ground: UAF, NATIVE, ARC-IONS
SPRING DEPLOYMENT (April 1-20, 2008) Eureka ISDAC ARCPAC ozonesondes (ARC-IONS) Focus on mid-latitude pollution transport, radiative forcing of Arctic haze, radical chemistry including halogens
SUMMER DEPLOYMENT (June 26 – July 13, 2008) Summit POLARCAT-GRACE POLARCAT-CNRS Pre-HIPPO Focus on boreal forest fires
MODIS FIRE COUNTS DURING ARCTAS July 2008 April 2008 Unusually early April start for Siberian fire season Fires in N. Saskatchewan, California, E. Siberia in June-July
MOPITT Anomalies for ARCTAS periods (2008) Difference from 9-yr monthly means; V4 column retrievals April June July L. Emmons, NCAR
CO AND ACETONITRILE (SPRING) A. Wisthaler, U. Innsbruck; G. Diskin, NASA LaRC
Stratospheric air Biomass burning Anthropogenicpollution MAJOR CHEMICAL SIGNATURES IN ARCTAS DATA (SPRING) EOF analysis of aircraft observations stratosphere biomass burning anthropogenic Q. Liang, NASA GSFC
MOZART-4 CO column contributions – April 1-19 L. Emmons, NCAR
CO tags from MOZART over Alaska ARCTAS (April 1-19) ARCPAC (April 11-23) Comparison of CO contributions during ARCTAS and ARCPAC Fire contribution is a bit higher during ARCPAC period than when including the first part of April Anthropogenic sources still dominate the CO distribution L. Emmons, NCAR
MOZART-4 CO column contributions – June 26-July 14 L. Emmons, NCAR
MEAN AEROSOL LATITUDE-ALTITUDE CURTAINS sulfate ammonium nitrate sea salt dust SPRING 170W-135W OC EC 60N > 7 km 2-7 km 0-2 km SUMMER 60N J. Hair, NASA LaRC; J. Dibb, UNH; B. Anderson, NASA LaRC
SULFATE IN ARCTAS (spring) SO2 from G. Huey (GIT), sulfate from J. Dibb (UNH) compared to GEOS-Chem model • dominant source in the model is from Asian pollution • overestimate may reflect insufficient scavenging from Asian outflow (cold clouds) J. Fisher, Harvard
MEAN C AEROSOL PROFILES (spring) DC-8 GEOS-Chem fires/anthro Organic Carbon (OC) Black Carbon (BC) no model scavenging below 258 K model scavenging at all T Observed OC correlates with CH3CN (r > 0.4) below 7 km but not above; Observed BC correlates with CH3CN below 2 km and with sulfate above Q. Wang, Harvard; B. Anderson, NASA LaRC
C AEROSOL DISTRIBUTIONS IN THE ARCTIC (April) Mean tropospheric concentrations simulated by GEOS-Chem BC OC Elevated values over Alaska are not representative of the Arctic Q. Wang, Harvard
MEAN OZONE LATITUDE-ALTITUDE CURTAINS SPRING 170W-135W 60N SUMMER 60N J. Hair (NASA LaRC)
OZONE-CO RELATIONSHIPS ARCTAS – Spring ARCTAS – Summer Anthropogenic airmass: ∆O3/∆CO = 0.05 Stratospheric airmass Anthropogenic airmass: ∆O3/∆CO = 0.08 Biomass burning: ∆O3/∆CO = -0.03 Biomass burning: ∆O3/∆CO = 0.28 Little indication of ozone production in fire or anthropogenic plumes in summer, ozone production in Russian fire plumes in April (aging?) Q. Liang, NASA GSFC
OZONE SOURCE ANALYSIS FROM OZONESONDES (summer) Stratospheric influence is present in summer but small A. Luzic, PSU
METHANE TIME SERIES, APRIL-JULY ARCTAS bookends pre-HIPPO ARCTAS (summer) ARCTAS (spring) Pre-HIPPO Hudson Bay lowlands stratosphere Observed GEOS-Chem April May June July C. Pickett-Heaps, Harvard; G. Diskin, NASA LaRC; S. Wofsy, Harvard
METHANE VERTICAL PROFILES IN HUDSON BAY LOWLANDS May 5 Jun 23 Jul 1 Jul 4 Jul 5 Model Obs. pre-HIPPO pre-HIPPO ARCTAS ARCTAS ARCTAS Onset of source in late June? Model source of 5 Tg a-1 in Hudson Bay Lowlands (Jed Kaplan bottom-up inventory) matches observations but is much higher than previous estimates (0.5-2 Tg a-1) C. Pickett-Heaps, Harvard; G. Diskin, NASA LaRC; S. Wofsy, Harvard
median model obs ELEMENTAL MERCURY IN ARCTAS (spring) Vertical profile Correlation with CO Observations Model no clear correlation w/anything pollution Stratospheric mixing line Surface mercury depletion events C. Holmes, Harvard; R. Talbot, UNH