Download
1 / 1
20 likes | 154 Vues
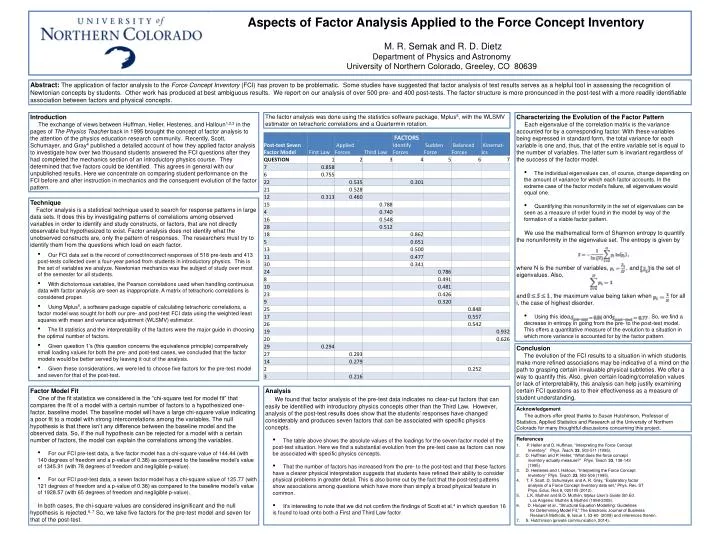
. Aspects of Factor Analysis Applied to the Force Concept Inventory M. R. Semak and R. D. Dietz Department of Physics and Astronomy University of Northern Colorado, Greeley, CO 80639.

E N D
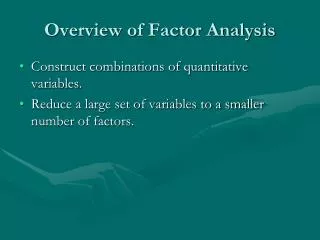
. Aspects of Factor Analysis Applied to the Force Concept Inventory M. R. Semak and R. D. Dietz Department of Physics and AstronomyUniversity of Northern Colorado, Greeley, CO 80639 Abstract: The application of factor analysis to the Force Concept Inventory (FCI) has proven to be problematic. Some studies have suggested that factor analysis of test results serves as a helpful tool in assessing the recognition of Newtonian concepts by students. Other work has produced at best ambiguous results. We report on our analysis of over 500 pre- and 400 post-tests. The factor structure is more pronounced in the post-test with a more readily identifiable association between factors and physical concepts. Introduction The exchange of views between Huffman, Heller, Hestenes, and Halloun1,2,3 in the pages of The Physics Teacher back in 1995 brought the concept of factor analysis to the attention of the physics education research community. Recently, Scott, Schumayer, and Gray4 published a detailed account of how they applied factor analysis to investigate how over two thousand students answered the FCI questions after they had completed the mechanics section of an introductory physics course. They determined that five factors could be identified. This agrees in general with our unpublished results. Here we concentrate on comparing student performance on the FCI before and after instruction in mechanics and the consequent evolution of the factor pattern. The factor analysis was done using the statistics software package, Mplus5, with the WLSMV estimator on tetrachoric correlations and a Quartermin rotation. • Characterizing the Evolution of the Factor Pattern • Each eigenvalue of the correlation matrix is the variance accounted for by a corresponding factor. With these variables being expressed in standard form, the total variance for each variable is one and, thus, that of the entire variable set is equal to the number of variables. The latter sum is invariant regardless of the success of the factor model. • The individual eigenvalues can, of course, change depending on the amount of variance for which each factor accounts. In the extreme case of the factor model’s failure, all eigenvalues would equal one. • Quantifying this nonuniformity in the set of eigenvalues can be seen as a measure of order found in the model by way of the formation of a viable factor pattern. • We use the mathematical form of Shannon entropy to quantify the nonuniformity in the eigenvalue set. The entropy is given by • where N is the number of variables, , and is the set of eigenvalues. Also, • and , the maximum value being taken when for all i, the case of highest disorder. • Using this idea, and . So, we find a decrease in entropy in going from the pre- to the post-test model. This offers a quantitative measure of the evolution to a situation in which more variance is accounted for by the factor pattern. • Technique • Factor analysis is a statistical technique used to search for response patterns in large data sets. It does this by investigating patterns of correlations among observed variables in order to identify and study constructs, or factors, that are not directly observable but hypothesized to exist. Factor analysis does not identify what the unobserved constructs are, only the pattern of responses. The researchers must try to identify them from the questions which load on each factor. • Our FCI data set is the record of correct/incorrect responses of 518 pre-tests and 413 post-tests collected over a four-year period from students in introductory physics. This is the set of variables we analyze. Newtonian mechanics was the subject of study over most of the semester for all students. • With dichotomous variables, the Pearson correlations used when handling continuous data with factor analysis are seen as inappropriate. A matrix of tetrachoric correlations is considered proper. • Using Mplus5, a software package capable of calculating tetrachoric correlations, a factor model was sought for both our pre- and post-test FCI data using the weighted least squares with mean and variance adjustment (WLSMV) estimator. • The fit statistics and the interpretability of the factors were the major guide in choosing the optimal number of factors. • Given question 1’s (this question concerns the equivalence principle) comparatively small loading values for both the pre- and post-test cases, we concluded that the factor models would be better served by leaving it out of the analysis. • Given these considerations, we were led to choose five factors for the pre-test model and seven for that of the post-test. Conclusion The evolution of the FCI results to a situation in which students make more refined associations may be indicative of a mind on the path to grasping certain invaluable physical subtleties. We offer a way to quantify this. Also, given certain loading/correlation values or lack of interpretability, this analysis can help justify examining certain FCI questions as to their effectiveness as a measure of student understanding. • Factor Model Fit • One of the fit statistics we considered is the “chi-square test for model fit” that compares the fit of a model with a certain number of factors to a hypothesized one-factor, baseline model. The baseline model will have a large chi-square value indicating a poor fit to a model with strong intercorrelations among the variables. The null hypothesis is that there isn’t any difference between the baseline model and the observed data. So, if the null hypothesis can be rejected for a model with a certain number of factors, the model can explain the correlations among the variables. • For our FCI pre-test data, a five factor model has a chi-square value of 144.44 (with 140 degrees of freedom and a p-value of 0.38) as compared to the baseline model’s value of 1345.91 (with 78 degrees of freedom and negligible p-value). • For our FCI post-test data, a seven factor model has a chi-square value of 125.77 (with 121 degrees of freedom and a p-value of 0.36) as compared to the baseline model’s value of 1928.57 (with 65 degrees of freedom and negligible p-value). • In both cases, the chi-square values are considered insignificant and the null hypothesis is rejected.6, 7 So, we take five factors for the pre-test model and seven for that of the post-test. • Analysis • We found that factor analysis of the pre-test data indicates no clear-cut factors that can easily be identified with introductory physics concepts other than the Third Law. However, analysis of the post-test results does show that the students’ responses have changed considerably and produces seven factors that can be associated with specific physics concepts. • The table above shows the absolute values of the loadings for the seven factor model of the post-test situation. Here we find a substantial evolution from the pre-test case as factors can now be associated with specific physics concepts. • That the number of factors has increased from the pre- to the post-test and that these factors have a clearer physical interpretation suggests that students have refined their ability to consider physical problems in greater detail. This is also borne out by the fact that the post-test patterns show associations among questions which have more than simply a broad physical feature in common. • It’s interesting to note that we did not confirm the findings of Scott et al.4 in which question 16 is found to load onto both a First and Third Law factor. Acknowledgement The authors offer great thanks to Susan Hutchinson, Professor of Statistics, Applied Statistics and Research at the University of Northern Colorado for many thoughtful discussions concerning this project. • References • 1.P. Heller and D. Huffman, “Interpreting the Force Concept • Inventory” Phys. Teach. 33, 503-511 (1995). • 2. D. Huffman and P. Heller, “What does the force concept • inventory actually measure?” Phys. Teach.33, 138-143 • (1995). • 3. D. Hestenes and I. Halloun, “Interpreting the Force Concept • Inventory” Phys. Teach.33, 502-506 (1995). • T. F. Scott, D. Schumayer, and A. R. Gray, “Exploratory factor • analysis of a Force Concept Inventory data set,” Phys. Rev. ST • Phys. Educ. Res 8, 020105 (2012). • 5. L.K. Muthén and B.O. Muthén, Mplus User’s Guide 5th Ed. • Los Angeles: Muthén & Muthén (1998-2009). • D. Hooper et al., “Structural Equation Modelling: Guidelines • for Determining Model Fit,” The Electronic Journal of Business • Research Methods, 6, Issue 1, 53-60 (2008) and references therein. • 7. S. Hutchinson (private communication, 2014).