Download
1 / 45
450 likes | 610 Vues
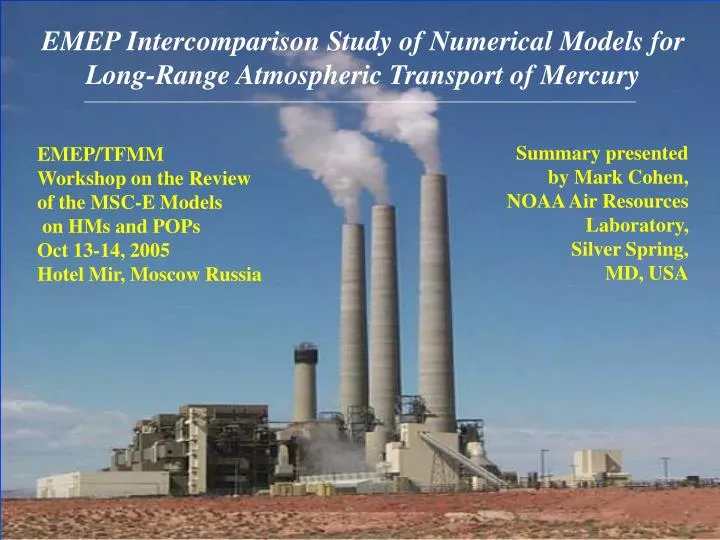
EMEP Intercomparison Study of Numerical Models for Long-Range Atmospheric Transport of Mercury. Summary presented by Mark Cohen, NOAA Air Resources Laboratory, Silver Spring, MD, USA.

E N D
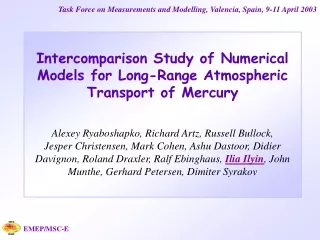
EMEP Intercomparison Study of Numerical Models for Long-Range Atmospheric Transport of Mercury Summary presentedby Mark Cohen, NOAA Air Resources Laboratory, Silver Spring, MD, USA EMEP/TFMM Workshop on the Review of the MSC-E Models on HMs and POPsOct 13-14, 2005Hotel Mir, Moscow Russia
Participants D. Syrakov ……………………………..Bulgaria…. NIMH A. Dastoor, D. Davignon ………………Canada...... MSC-Can J. Christensen…………………………. Denmark…NERI G. Petersen, R. Ebinghaus…………......Germany…GKSS J. Pacyna ………………………………. Norway….. NILU J. Munthe, I. Wängberg ……………….. Sweden….. IVL R. Bullock ………………………………USA………EPA M. Cohen, R. Artz, R. Draxler ………… USA………NOAA C. Seigneur, K. Lohman ………………..USA……... AER/EPRI A. Ryaboshapko, I. Ilyin, O.Travnikov…EMEP…… MSC-E 2
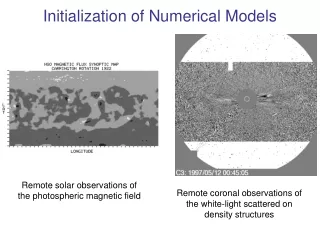
Intercomparison Conducted in 3 Stages • Comparison of chemical schemes for a cloud environment • Air Concentrations in Short Term Episodes • Long-Term Deposition and Source-Receptor Budgets 3
Intercomparison Conducted in 3 Stages • Comparison of chemical schemes for a cloud environment • Air Concentrations in Short Term Episodes • Long-Term Deposition and Source-Receptor Budgets 5
Atmospheric Mercury Elemental Mercury [Hg(0)] cloud Hg(II), Reactive Gaseous Mercury [RGM] Particulate Mercury [Hg(p)] CLOUD DROPLET Hg(II) reducedto Hg(0) by SO2 and sunlight Vapor phase Hg(0) oxidized to RGM and Hg(p) by O3, H202, Cl2, OH, HCl Adsorption/ desorption of Hg(II) to /from soot Hg(p) Hg(p) Dissolution? Primary Anthropogenic Emissions Hg(0) oxidized to dissolved Hg(II) species by O3, OH, HOCl, OCl- Re-emission of previously deposited mercury Natural emissions Wet and Dry Deposition 6
Effect of Different Assumptions Regarding Hg(p) SolubilityAER/EPRI 0%; MSCE-EMEP 50%; CMAQ-EPA 100% 8
Stage I Publications: 2001 Ryaboshapko, A., Ilyin, I., Bullock, R., Ebinghaus, R., Lohman, K., Munthe, J., Petersen, G., Seigneur, C., Wangberg, I. Intercomparison Study of Numerical Models for Long Range Atmospheric Transport of Mercury. Stage I. Comparisons of Chemical Modules for Mercury Transformations in a Cloud/Fog Environment. Meteorological Synthesizing Centre – East, Moscow, Russia. 2002 Ryaboshapko, A., Bullock, R., Ebinghaus, R., Ilyin, I., Lohman, K., Munthe, J., Petersen, G., Seigneur, C., Wangberg, I. Comparison of Mercury Chemistry Models. Atmospheric Environment36, 3881-3898. 9
Intercomparison Conducted in 3 Stages • Comparison of chemical schemes for a cloud environment • Air Concentrations in Short Term Episodes • Long-Term Deposition and Source-Receptor Budgets 10 10
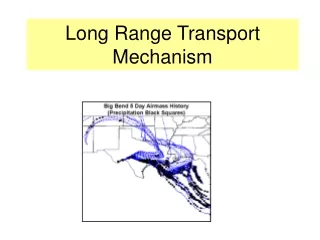
Mace Head, Ireland grassland shore Aspvreten, Sweden forested shore Rorvik, Sweden forested shore Zingst, Germany sandy shore Neuglobsow, Germany forested area Anthropogenic Mercury Emissions Inventoryand Monitoring Sites for Phase II(note: only showing largest emitting grid cells) 12
Mace Head Aspvreten Rorvik Zingst Neuglobsow 13
Neuglobsow NW S SE N NW N NW NW Total Gaseous Mercury at Neuglobsow: June 26 – July 6, 1995 14
Total Gaseous Mercury (ng/m3) at Neuglobsow: June 26 – July 6, 1995 15
Using alternative emissions inventory Total Gaseous Mercury (ng/m3) at Neuglobsow: June 26 – July 6, 1995 The emissions inventory is a critical input to the models… Using default emissions inventory 16
Total Particulate Mercury (pg/m3) at Neuglobsow, Nov 1-14, 1999 17
EMEP Intercomparison Study of Numerical Models for Long-Range Atmospheric Transport of Mercury Intro-duction Stage I Stage II Stage III Conclu-sions Chemistry Hg0 Hg(p) RGM Wet Dep Dry Dep Budgets Reactive Gaseous Mercury at Neuglobsow, Nov 1-14, 1999 18
EMEP Intercomparison Study of Numerical Models for Long-Range Atmospheric Transport of Mercury Intro-duction Stage I Stage II Stage III Conclu-sions Chemistry Hg0 Hg(p) RGM Wet Dep Dry Dep Budgets TGM: all within a factor of 1.35 RGM: 90% within a factor of 10 TPM: 90% within a factor of 2.5 RGM: 50% within a factor of 2 Deviation Factor Overall Phase II statistics for 2-week episode means TGM: 2-week mean concentrations within factor of 1.35 TPM: 90% within factor of 2.5 RGM:90% within a factor of 10; 50% within a factor of 2 19
Stage II Publications: 2003 Ryaboshapko, A., Artz, R., Bullock, R., Christensen, J., Cohen, M., Dastoor, A., Davignon, D., Draxler, R., Ebinghaus, R., Ilyin, I., Munthe, J., Petersen, G., Syrakov, D. Intercomparison Study of Numerical Models for Long Range Atmospheric Transport of Mercury. Stage II. Comparisons of Modeling Results with Observations Obtained During Short Term Measuring Campaigns. Meteorological Synthesizing Centre – East, Moscow, Russia. 2005 Ryaboshapko, A., Bullock, R., Christensen, J., Cohen, M., Dastoor, A., Ilyin, I., Petersen, G., Syrakov, D., Artz, R., Davignon, D., Draxler, R., and Munthe, J. Intercomparison Study of Atmospheric Mercury Models. Phase II. Comparison of Models with Short-Term Measurements. Submitted to Atmospheric Environment. 20
Intercomparison Conducted in 3 Stages • Comparison of chemical schemes for a cloud environment • Air Concentrations in Short Term Episodes • Long-Term Deposition and Source-Receptor Budgets 21 21
European anthropogenic Hg re-emissions 50 t/yr European natural Hg emissions 180 t/yr 2000 European anthropogenic Hg emissions 240 t/yr
global natural Hg emissions 1800 t/yr 1995 global anthropogenic Hg emissions 1900 t/yr
Due to resource constraints, not all models simulated the entire year 1999… 25
There are uncertainties in measurements -- even of precipitation amount… 26
~100% within a factor of 10 ~80% within a factor of 3 ~60% within a factor of 2 ~90% within a factor of 5 Wet Deposition Summary 30
For dry deposition, there are no measurement results to compare the models against; • However, the models can be compared against each other… 31
In the following, the total model-predicted deposition (= wet + dry) is compared 35
Total Modeled Hg Deposition (wet + dry) Note: ADOM was not run for August, so for this graph, ADOM results for July were used 37
Main items of mercury atmospheric balance for the UK in 1999, t/yr 39
Items of Hg atmospheric balances for the countries in 1999, t/yr[average modeled result (with ranges in parentheses)] 40
Stage III Publication: 2005 Ryaboshapko, A., Artz, R., Bullock, R., Christensen, J., Cohen, M., Draxler, R., Ilyin, I., Munthe, J., Pacyna, J., Petersen, G., Syrakov, D., Travnikov, O. Intercomparison Study of Numerical Models for Long Range Atmospheric Transport of Mercury. Stage III. Comparison of Modelling Results with Long-Term Observations and Comparison of Calculated Items of Regional Balances. Meteorological Synthesizing Centre – East, Moscow, Russia. 42
Conclusions: Uncertainties in Mercury Modeling • Elemental Hg in air - factor of 1.2 • Particulate Hg in air - factor of 1.5 • Oxidized gaseous Hg in air - factor of 5 • Total Hg in precipitation - factor of 1.5 • Wet deposition - factor of 2.0 • Dry deposition - factor of 2.5 • Balances for countries - factor of 2 43
Conclusions • Based on this Intercomparison Study, EMEP operational models for mercury correspond to the most advanced scientific models in terms of formulation and with respect to the accuracy of modelling results; • Based on this Intercomparision Study, EMEP operational models for mercury can provide useful, policy-relevant data in conjunction with the goals of the HM Protocol. 44
Thanks! • All of the participants in the mercury modeling study are grateful to MSC-East for their leadership and collegiality throughout the project • The scientific community’s understanding of atmospheric mercury and models have benefited greatly from this project 45