Download

1 / 57
570 likes | 667 Vues
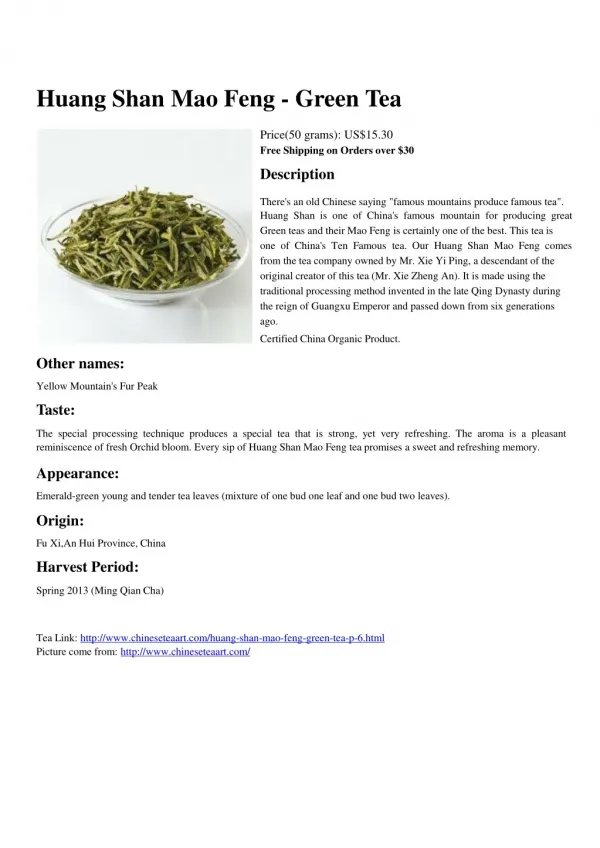
Visual Representations of Data and Knowledge. Mao Lin Huang University of Technology, Sydney,. Rendering Effective Route Maps. General Idea. Automatically generate a route map that has the same properties as a hand drawn map. Hand drawn maps: Exaggerated Lengths (non-constant scale factor)

E N D
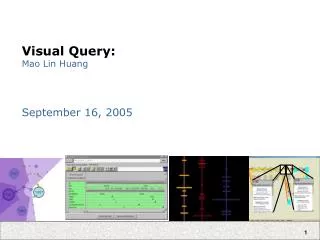
Visual Representations of Data and Knowledge Mao Lin Huang University of Technology, Sydney,
General Idea • Automatically generate a route map that has the same properties as a hand drawn map. • Hand drawn maps: • Exaggerated Lengths (non-constant scale factor) • No irrelevant information
More Specifically • Constant scale factor • Road lengths on a conventional map vary in several orders of magnitude => small roads and neighborhoods are hard to navigate with large maps • Information irrelevant to navigation • Names of locations, places, cities, etc. that are all far away from the route • Takes up space that would be otherwise useful for showing crossroads and relevant landmarks
Generalization Techniques • Generalize Length • Use more space for short roads, less for longer ones. Distribute based on importance, not physical length • Generalize Angle • Align roads or make room for others • Generalize Shape • Navigator doesn’t need to know roads shape. • Simpler roads are easier to differentiate on a map.
Simple Visualization Model Data View Port Visual Mapping
Film Data Table Example: Attributes
Visual Mapping • Define a Space • Map: data marks • Map: data attributes graphical mark attributes • Year X • Length Y • Popularity size • Subject color • Award? shape
Use of graphical time scales as an approach to visualize histories. [Time Scale + History = Intuitive]
Galaxies • Projection of clustering algorithms into 2D • Galaxies are clusters of related data • Proximity of galaxies is relevant • Designed to add temporal patterns to clustering
3D Cone Tree 16
3D Cone Trees 17 research.microsoft.com/~ggr/gi97.ppt
Perspective Wall 18 research.microsoft.com/~ggr/gi97.ppt
Example: 3D-Room (The Exploratory) 20 Robertson, Card, and Mackinlay (1989)
3D Navigation Task (Hallway) research.microsoft.com/~ggr/gi97.ppt 21
3D GUI for Web Browsing http://research.microsoft.com/ui/TaskGallery/index.htm 23
Web Forager http://research.microsoft.com/ui/TaskGallery/index.htm 24
WebBook research.microsoft.com/~ggr/gi97.ppt 25
3D GUI for Desktop http://research.microsoft.com/ui/TaskGallery/index.htm 26
ThemeScape • Abstract 3D landscape of information • Reduce cognitive load using terrain • Elevation, colour encode theme strength redundantly • Landscape metaphor translates well • Peaks are easy to recognize • Interesting characteristics include ridges and valleys
Calendar Based Visualization • Using 3 dimensions • X-axis: Time of day • Y-axis: Days of data period • Z-axis: Univariate data samples
Graph-Driven Visualization of Relational Data Graph Visualization An example of visualizing relational data. This is the visualization of a family tree (graph). Here each image node represents a person and the edges represent relationships among these people in a large family.
Classical Graph Layouts • Link-node diagrams • Layout algorithms (graph drawing) • Geometric positioning of nodes & edges • Small amount of nodes • Avoid node overlaps • Reduce edge crossings radial layout symmetric force-directed hierarchical orthogonal
Using a very large virtual page The virtual page technique predefines the drawing of the whole graph, and then provides a small window and scroll bar to allow the user to navigate through it (by changing the viewing area).
Fish-eye views The fish-eye technique can keep a detailed picture of a part of a graph as well as the global context of the graph. It changes the zoomed focus point.
3D Graph Drawing SGI fsn file-system viewer Image from: http://www.sgi.com/fun/images/fsn.map2.jpg
2 Approaches A • Connection (node & link) • Enclosure (node in node) • Structure vs. attributes • Attributes only (multi-dimensional viz) • Structure only (1 attribute, e.g. name) • Structure + attributes B C A B C
Treemaps (Shneiderman) • Slice and Dice • Alternate horizontal andvertical cuts for levels • Node area node attribute • Zoom onto nodes • Space-Filling • Structure + 3 attributes • Area, color, label
Treemaps • ~ 1000 nodes • Quantitative attributes • Good combination of structure + attributes • For unbalanced trees, structure more difficult • Learning time: 20 min • Evaluation: major performance boost over outliner • Bad aspect ratios: long narrow rectangles • Large scale or deep causes solid black
Treemap Algorithm • Calculate sizes: • Recurse to children • My size = sum children sizes • Draw Treemap (node, space, direction) • Draw node rectangle in space • Alternate direction • For each child: • Calculate childspace as % of node space using size and direction • Draw Treemap (child, child space, direction)