Download
1 / 29
300 likes | 476 Vues
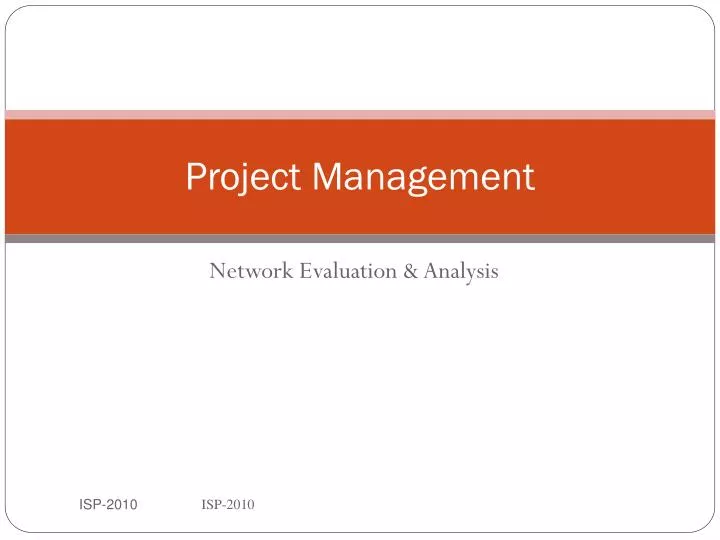
Project Management. Network Evaluation & Analysis. ISP-2010. 1. PERT / CPM. Typical questions project manager need to know: What is the total time required to complete the project? What are the schedule start and finish dates for the specific activity?

E N D
ISP-2010 Project Management Network Evaluation & Analysis ISP-2010 1
ISP-2010 PERT / CPM • Typical questions project manager need to know: • What is the total time required to complete the project? • What are the schedule start and finish dates for the specific activity? • Which activities are “critical” and must be completed exactly as scheduled to keep the project on schedule? • How long can “non-critical” activities be delayed before they cause a delay in the total project? ISP-2010 2
ISP-2010 PERT / CPM • PERT/CPM • Program Evaluation Review Technique / Critical Path Method • is used to plan the scheduling of individual activities that make up the project. • PERT/CPM allows us to determine; • the earliest/latest start and finish times for each activity in order to determine project’s completion time. ISP-2010 3
ISP-2010 What to Consider • The project manager should consider the following: • Is the activity on arc or it’s an activity on node network • The earliest time of the activities • The latest time of activities • The slack of the activities which is key in the determination of the network critical path • The activity with a slack of zero is critical. • The critical path of the activities • Estimates ISP-2010 4
ISP-2010 PERT/CPM Network • This network model can be constructed to represent the precedence of activities. • Arcs in the network model represent the activities - PERT. • Nodes of the network model represent points in time when an activity (or group of activities) has been completed - CPM. • Rule: • Two different activities should not have the same starting and ending nodes. • Dummy activities (with activity time equal zero) are used to indicate that proper set of the activities has been completed prior to the start of another activity. ISP-2010 5
ISP-2010 PERT/CPM • PERT uses the probabilistic time estimates and t • CPM uses the deterministic time estimates • Both methods • determine the critical path of the project and the estimated completion time. • On large projects, software programs are available to identify the critical path, e.g. the Microsoft project Manager 2000, 2003, etc. ISP-2010 6
ISP-2010 Critical Path • The time between the earliest time and the latest time an activity can begin, is called the slack time for an activity. • Activities which do not have any slack (their slack time equals zero) are called critical activities and lie on the critical path of the project. • Delay in any of the critical activities resultsin delaying project’s completion time. ISP-2010 7
ISP-2010 Properties of Critical Path • A project network always has a critical path, and sometimes there are more than one. • Allactivities having zeroslack must lie on a critical path, where as no activitieshaving slack greater than zero can lie on a critical path. • Activities on the critical path should not be delayed • The activities on the critical path have the highest project schedule. • The total time of all activities on the critical paths is called the critical time and is normally the total duration of the project. ISP-2010 8
ISP-2010 Total Float and Critical Path • Total float is how many delays are allowed from the beginning of the project which will not interfere with the projected completion date. • Anything can happen during the course of working on an extended task. • Outdoor projects can be affected by adverse weather conditions which might create delays of hours or even days. • Even indoor projects and virtual tasks can be met with unforeseen circumstances which sidetrack workers on the job. • These delays are known as the total float, and project management must always keep this number in mind to ensure that the project will be finished on time. • In order to determine the total float, project management use the critical path method, and they can also figure the earliest possible and latest completion dates for the task. • Ideally, a project should never go beyond the late finish date, and by knowing how many days are built into the schedule for delays, those in management can keep the project running right on schedule. ISP-2010 9
ISP-2010 Project Networks ACTIVITY (TASK) --A work component needed to be accomplished; a task within the overall project that has a definite beginning and ending point. The activity consumes time. EVENTS -- Designates the beginning and / or ending of activities. A point in time. Also shows the precedence relationships of the activities. NETWORK -- A combination of Activities and Events that describe the logic of the project. There is one definite starting and ending point. ISP-2010 10
ISP-2010 A B A B Task Relationships • Relationships determine the way task follow each other • Finish-to-Start • Task B cannot start until Task A is finished • Most common type • Start-to-Start • Task B cannot start until Task A is started • A delay is often used in this relationship ISP-2010 11
ISP-2010 Precedence Relationships Task C cannot begin if both A and B have not completed. A and B are parallel tasks and they can start at the same time. A C D B Task D can begin after B is completed. Task E may begin after C is completed. A-B-D-F and A-C-E-F are parallel paths. One of the two path is critical, but not both. B D A F E C ISP-2010 13
ISP-2010 Example of a Project ISP-2010 14
ISP-2010 Network Diagram C 4 2 2 F 3 A 2 H Start Finish E 6 7 1 4 2 5 3 B G 4 3 5 D Together we going to calculate the Earliest Start Time and the Earliest Finish time for the project. • We are using the activity on Arrow method ISP-2010 15
ISP-2010 Earliest Time Calculations • Earliest Time are in two fold: • Earliest start time (ES) • Earliest finish time (EF) • Earliest start - Earliest time expected to complete all previous tasks. • Earliest finish -The earliest finish time is defined as the earliest start time plus activity time • Note that activities/tasks start/completion relies much on the whether the previous task has ended. • This is where these two definitions bind to the task time ISP-2010 16
ISP-2010 Latest Time Definitions • Latest time considers the following: • Latest start (LS) • Latest finish (LF) • Latest Start – Latest time is the difference between the latest finish time and the task time • Latest Finish - Latest time is the time a task can take and still allow the project to finish on time. • Slack time – (LS – ES) or (LF – EF) ISP-2010 17
ISP-2010 Exercise 1 • Draw a table for the below activities showing the precedence • Calculate the ES and EF for each activity. 2 14 6 6 4 2 2 4 5 3 3 ISP-2010 18
ISP-2010 Probabilistic Time Estimates • The three time estimates used by PERT for each activity are a • most likely estimate, • an optimistic estimate, and • a pessimistic estimate. ISP-2010 19
ISP-2010 Probabilistic Estimates • The most likely estimate mt, is intended to be the most realistic estimate of the mode of the probability distribution for the activity time. • The optimistic estimate denote by ot, is the unlikely but possible time if everything goes well. • It’s the lower bound of the probability distribution ISP-2010 20
ISP-2010 Probabilistic Estimate – Cont’n • The pessimistic estimate denoted by pt, is the unlikely but possible time if everything goes badly. • It’s the upper bound of the probability distribution. THE BETA DISTRIBUTION ot mt pt ISP-2010 21
ISP-2010 Expected time • The expected time for finishing each activity is a weighted average given by the following equation Expected Time = optimistic + 4(most likely) + pessimistic 6 = ot + 4mt + pt 6 The standard deviation between the optimistic and pessimistic estimate is σ = pt - ot 6 And the variance σ2 = (pt – ot)2 36 ISP-2010 22
ISP-2010 • Redraw the network showing the LS and LF, and Compute the slack for each task. Deduce the activities on the critical path. Exercise 2 ISP-2010 23
ISP-2010 Network Analysis Steps • Task Definition and Decomposition • Define Relationships • Estimate Task Times • Construct Diagram • Network Evaluation • Project Tracking and Revision ISP-2010 24
ISP-2010 Network Evaluation Steps • Construct network diagram showing tasks, relationships and task times using standard format • Define the various paths through the network • Moving from left-to-right calculate the ES (Earliest Start) and EF (Earliest Finish) time for each task • Define Critical Path • Moving from right-to-left calculate the LF(Latest Finish) and LS (Latest Start) for each task • Note Slack Times ISP-2010 25
ISP-2010 Exercise 3 • Draw a network Diagram for the above Table • Determine the critical path of the network. What is the critical time? ISP-2010 26
ISP-2010 Exercise 4 1. Draw the Network Diagram for the Project activities. 2. Draw a bar char to Represent the network ISP-2010 27
ISP-2010 Project Completion Date Reduction • Project completion date may be required to reduced; • May be because of limited resources • Penalties • If the promised completion date was big • The technique of reducing project completion dates is termed as ‘crashing’. • The critical activities of the project are always crashed. • This may bring more activities on the critical path. • Crashing activities makes the project expensive ISP-2010 28
ISP-2010 Purpose of Crashing • To reduce on the overall schedule of the project • Balance project costs on the activities • During crashing, • You need to know the duration of each activity • The duration of each activity • The following equation is used during crashing • Note that not all activities are crashed in the project Crash cost/duration = (crash cost-normal cost)/(normal time – crash time) ISP-2010 29
ISP-2010 Project Management Across Organizations • Accounting uses project management (PM) information to provide a time line for major expenditures • Marketing use PM information to monitor the progress to provide updates to the customer • Information systems develop and maintain software that supports projects • Operations use PM to information to monitor activity progress both on and off critical path to manage resource requirements. ISP-2010 30