Download
1 / 1
10 likes | 206 Vues
Cluster 8. Cluster 19. Cluster 8. Cluster 19. Cluster 8. METHANOMICROBIALES. Cluster 19. (Probes mcrA clusters 8, 9, 10, 19). Cluster 8. Cluster 10. Cluster 9. METHANOCELLALES (Probe mcrA M. paludicola ). Cluster 20. Cluster 13. Cluster 12. Cluster 11. METHANOSARCINALES.

E N D
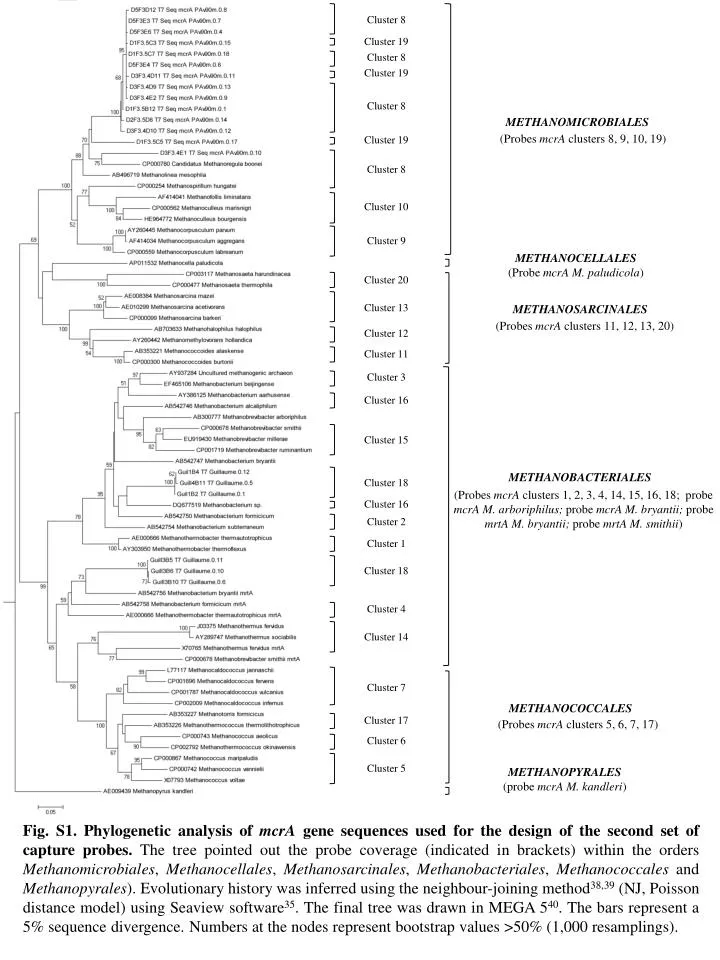
Cluster 8 Cluster 19 Cluster 8 Cluster 19 Cluster 8 METHANOMICROBIALES Cluster 19 (Probes mcrA clusters 8, 9, 10, 19) Cluster 8 Cluster 10 Cluster 9 METHANOCELLALES (Probe mcrAM. paludicola) Cluster 20 Cluster 13 Cluster 12 Cluster 11 METHANOSARCINALES Cluster 3 (Probes mcrA clusters 11, 12, 13, 20) Cluster 16 Cluster 15 Cluster 18 Cluster 16 Cluster 2 Cluster 1 Cluster 18 Cluster 4 METHANOBACTERIALES Cluster 14 (Probes mcrA clusters 1, 2, 3, 4, 14, 15, 16, 18; probe mcrA M. arboriphilus; probe mcrA M. bryantii; probe mrtA M. bryantii; probe mrtA M. smithii) Cluster 7 Cluster 17 Cluster 6 Cluster 5 METHANOPYRALES (probe mcrA M. kandleri) METHANOCOCCALES Fig. S1. Phylogenetic analysis of mcrA gene sequences used for the design of the second set of capture probes. The tree pointed out the probe coverage (indicated in brackets) within the orders Methanomicrobiales, Methanocellales, Methanosarcinales, Methanobacteriales, Methanococcales and Methanopyrales). Evolutionary history was inferred using the neighbour-joining method38,39 (NJ, Poisson distance model) using Seaview software35. The final tree was drawn in MEGA 540. The bars represent a 5% sequence divergence. Numbers at the nodes represent bootstrap values >50% (1,000 resamplings). (Probes mcrA clusters 5, 6, 7, 17)