Download
1 / 15
160 likes | 469 Vues
BPI. Best Procurement Implementation. Best Practice Toolkit Evaluation matrix user guide. Contents. Engage the Commodity Team Components of the evaluation matrix Weights Sub-Weights Evaluating the ability to supply a national contract Evaluating the total cost of supply

E N D
BPI Best Procurement Implementation Best Practice ToolkitEvaluation matrix user guide
Contents • Engage the Commodity Team • Components of the evaluation matrix • Weights • Sub-Weights • Evaluating the ability to supply a national contract • Evaluating the total cost of supply • Scoring and benchmarking the suppliers • The evaluation matrix as a worksheet in excel
Engage the Commodity Team • The evaluation criteria was agreed at a meeting with all Commodity Team • Introduce the decision matrix concept Criteria Gloves example
The components in the evaluation Matrix After-Sales Quality Costing Structure Ability to supply a national contract Performance Delivery Commercial Price 7 KEY components in the evaluation matrix
Components of the evaluation matrix defined PERFORMANCE Quality Total Quality Management System. This includes past performance data on achieving an ave of 85% one day replacement turnaround/ complaints/ replacement and rejected goods process, certification and customer quality awards. The complete service offering. This includes dedicated staff/customer satisfaction/perf mgt and uptake reporting/process improvements and cost reductions /Core & non-core list. After-sales Costing Structure Ability to assess the suppliers total cost model. This includes open book costing and price fixing. Delivery On time delivery and flexibility. This includes turnaround times/ the suppliers ability to meet unscheduled requests/past performance data on achieving 85% or more on-time deliveries and delivery point improvements. Commercial viability. This includes the effectiveness of the implementation plans/board level support network/ financial stability and the level of the organisation’s influence over the supplier (For example, negotiating power). Commercial Ability to supply a national contract The ability of the supplier to supply to all delivery points in the preferred delivery option. Price The total price tendered including all discounts and additional costs.
How the evaluation matrix uses weighting The next stage is to find the weight for each component in the evaluation matrix The sub-weights will be included in the score for each performance criteria. Sub-weights will be applied to each tender question and summed into a total % All calculations in the evaluation matrix have been automated.
Each Team contributes to finding the weight In the decision matrix: ‘Yes’ replaced by 1, ‘No’ replaced by -1 Commodity Team asked to answer ‘Yes’ or ‘No’ on what criteria is more important than another Specific questions have been designed to derive the opinion of each Team member concerning the level of importance for each criteria
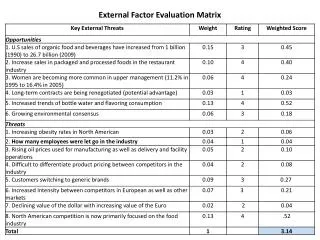
Calculate the weight from the Commodity Team responses STEP 1 EVALUATION CRITERIA - DRAFT STEP 2 STEP 3 Sum of all the negative numbers in the total column - = Total for each criteria Weight for each criteria Enter the Team responses as a 1 or -1 into the decision matrix which will automatically calculate the total/Rank/Weight/Weight %
Each Commodity Team member contributes to finding the sub-weights Each Team member rates each topic between 1 – 3, (3 is critically important, 2 is important and 1 is nice to have) STEP 2 STEP 1 fx = (AVERAGE) ●Find the average of all Team member responses STEP 3 = Sub-weight for each tender question (the importance of each tender question)
Each sub-weight will place a level of importance against each tender question Step 1 Step 3 Step 2 Tender Score for Each tender que = x Sub – Weight Yes = 1 No = 0 Tender Que
Calculate the total score for each criteria Sum the total score STEP 1 } Calculate as a percentage STEP 2 Enter the criteria specific percentage into the evaluation matrix STEP 3 All steps are automatic.
Calculation of weights and sub-weights have been automated WEIGHT Just type ‘Yes’ or No’ respectively for each participating organisation in the yellow shaded boxes & Just type the exact rating that each Commodity Team Member has advised in the yellow shaded boxes SUB-WEIGHT 3 spreadsheets will automatically calculate the weight and sub-weight data
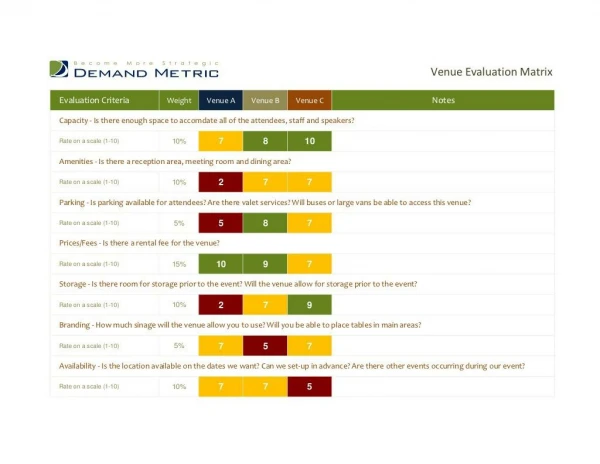
Measuring the ability to supply a national contract Step 2 Step 1 Step 3 The spreadsheet will calculate the total score: Total Score Max Score Suppliers answer ‘Yes’ or ‘No’ on their ability to deliver to each delivery point \ Yes =1 No =0 = Sliding Rating X 100 All calculations in the evaluation matrix have been automated. The sliding rating system awards each supplier a score relative to their ability to meet the delivery requirements.
Measuring the total cost of supply Step 2 Step 4 Step 1 Step 3 Enter the total amount of the lowest cost supplier Sum and find % total score for each supplier The spreadsheet will calculate the % scoring: Lowest Cost Supplier Cost \ Enter the total cost (including all discounts/charges) for the each turnaround time Sliding Rating = X 100 The sliding rating system awards each supplier a score relative to the lowest cost. The lower the cost, the higher the score.
Score and benchmark each supplier The total score is the sum of all the 7 evaluation components Benchmark the tender score by ranking each supplier All calculations in the evaluation matrix have been automated.