Download
1 / 38
380 likes | 463 Vues
Northwest Climate: the mean. Factors that influence local/regional climate : 1. Latitude day length, intensity of sunlight 2. Altitude 3. Mountain Barriers 4. Proximity to the ocean ocean currents 5. location relative to prevailing winds. Winter winds and pressure over

E N D
Northwest Climate: the mean • Factors that influence local/regional climate: • 1. Latitude • day length, intensity of sunlight • 2. Altitude • 3. Mountain Barriers • 4. Proximity to the ocean • ocean currents • 5. location relative to prevailing winds
Winter winds and pressure over the North Pacific Summer winds and pressure over the North Pacific L L H H “Subtropical High” “Aleutian Low”
Oregon Climate Service http://www.ocs.orst.edu
Northwest terrain maps the big-picture winds and storms onto a complex landscape • localized cold air outbreaks • the Puget Sound Convergence Zone • rain shadows
The Puget Sound Convergence Zone http://www.atmos.washington.edu/~ovens/loops/wxloop.cgi?atx_n0r+/12h/30m
The predictable part: seasonal rhythms Puget Sound Precip Insolation Insolation Oct Feb Jun Upwelling winds at 48N Oct Feb Jun Jan May Sep Amphitrite Pt SST Oct Feb Jun
Year to year variations on the seasonal rhythms Monthly Puget Sound Precip Daily Upwelling winds Monthly Amphitrite Pt SST
Pollen records on the Olympic Peninsula Crocker Lake cedars alder df pines McLachlan, J. S. and L. B. Brubaker. 1995 Local and regional vegetation change on the northeastern Olympic Peninsula during the Holocene. Canadian J. of Botany.
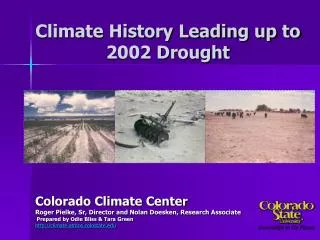
The Dust Bowl (1929-1931) was probably not the worst drought sequence in the past 250 years (based on Columbia Basin Tree-ring chronologies) red = observed, blue = reconstructed Source: Gedalof, Z., D.L. Peterson and Nathan J. Mantua. (2004). Columbia River Flow and Drought Since 1750. Journal of the American Water Resources Association.
PNW climate variability 1. What does our region’s climate history tell us about “natural variability”? 2. How is climate variability experienced in the Pacific Northwest? * are there patterns within the region? * are there preferred frequencies of change (year to year, decade to decade, etc.) 3. Why does our climate vary?
Warm and cool (or “wet” and “dry”) halves of the year: oct-mar versus apr-sep What do you see?
Characteristics of variability? • Lots of year-to-year variability in both halves of the year; longer-term variations • Multi-decadal “cycles” and century long trends • temperatures and precipitation are more variable in cool season than in warm season
Washington State Oct-Sept Total Precip 48 36 1907 1927 1947 1967 1987 2007 Washington State Oct-Sept Average Temperature 50 48 46 1907 1927 1947 1967 1987 2007
March 15 Snow depth anomalies at Paradise, Mt Rainier Avg=4 meters Avg ~ 4 meters (170 inches) January 5, 2005: 48 inches January 6, 2007: 130 inches
Water Year Columbia River streamflow Average annual runoff at The Dalles, Oregon ~ 150 Million Acre-Feet (MAF); Oct 2000-September 2001 ~ 100 MAF
NW Climate variability • Why the strong climate changes? • The chaotic nature of the climate system • big volcanic eruptions • natural modes of climate variability internal to the climate system: • in the Pacific sector, changes in ENSO and PDO are important factors
Oct 97-Mar 98: El Niño Oct 98-Mar 99: La Niña
El Niño year precip anomalies Oct 1997- Mar 1998 La Niña year precip anomalies Oct 1998- Mar 1999
Regional patterns? • Typically, cool-season (oct-mar) climate anomalies are coherent throughout most of the PNW region • warm-season climate anomalies also tend to be regionally coherent, but to a lesser degree
Accumulated daily rainfall: Oct 1 1998-Sept 20 1999 A very wet year everywhere but Yakima! http://www.cpc.ncep.noaa.gov/products/analysis_monitoring/ensostuff/current_impacts/global_precip_accum.html
“composite avg” PNW temperature and precipitation during El Niño and La Niña (based on averages of past century’s events) EN-LN
The Pacific Decadal Oscillation • an El Niño-like pattern of climate variability • 20 to 30 year periods of persistence in North American and Pacific Basin climate • warm extremes prevailed from 1925-46, and again from 1977-98; a prologed cold era spanned 1947-76 1925 1947 1977 1998? Mantua et al. 1997, BAMS
Real time “nowcasts” of the PDO? Because we don’t know how the PDO works (key mechanisms for decadal patterns remain mysterious), we can’t be sure that the SST pattern (and PDO index) is a good indicator for where we are with this pattern. Recent years have a variable PDO index…but perhaps no moreso than the late 1980s… Monthly PDO index: 1970-Nov 2008 http://jisao.washington.edu/pdo
Water year stream flow composites for Columbia River “natural” flows at The Dalles, Oregon
PDO/ENSO and NW hydrology • Because extremes in ENSO and PDO tend to favor either “warm and wet” or “cool and dry” conditions, these combinations lead to amplified responses in snowpack and streamflow • Ex: cold wet weather, lower snowline, more precipitation, more snow, less evaporation and more runoff
Recent La Niña Year snowpack 1998-99 http://www.skimountaineer.com/CascadeSki/ParadiseCraterLakeSnow.php
Recent La Niña Year snowpack 2000-01 http://www.skimountaineer.com/CascadeSki/ParadiseCraterLakeSnow.php
Recent La Niña Year snowpack 2005-06 http://www.skimountaineer.com/CascadeSki/ParadiseCraterLakeSnow.php
Last year http://www.wcc.nrcs.usda.gov/snow/ This year