Download
1 / 27
270 likes | 415 Vues
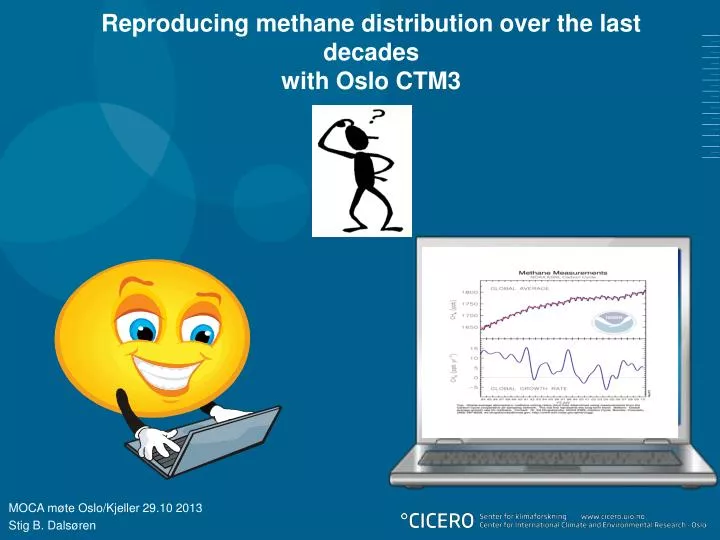
Reproducing methane distribution over the last decades with Oslo CTM3. MOCA møte Oslo/Kjeller 29.10 2013 Stig B. Dalsøren. Overall objective “ Explain the recent increase in atmospheric methane and quantify the effect of realistic future methane levels”

E N D
Reproducing methane distribution over the last decades with Oslo CTM3 MOCA møte Oslo/Kjeller 29.10 2013 Stig B. Dalsøren
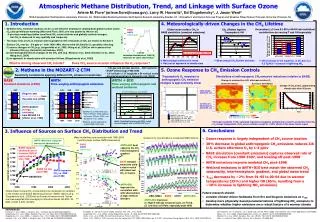
Overall objective “Explain the recent increase in atmospheric methane and quantify the effect of realistic future methane levels” WP 1: Analysis of the historic level and development of methane WP 2: Assessment of the recent development and current level of methane WP 3: Future development of methane levels and corresponding climate impact
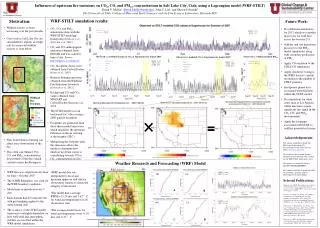
Global Chemical Transport modelOsloCTM3 Horizontal: T42: 2.8 x 2.8 degrees (T159: 1.125 x 1.125 degrees) Vertical: 60 layers Processes Figure from (Seinfeld and Pandis, 1998).
Chemistry Gas phasechemistry 90 species 18 tracers, one for eachmethaneemissionsector Aerosols Sulphate Sea salt Nitrate (Black/organiccarbon) (Mineral dust) (SOA) (not included in thesesimulations)
Anthropogenicmethaneemissions 1970-2008 from Edgar 4.2 database
Natural methaneemissions 1984-2009 from Philippe Bousquet (Basedon Bousquet et al. 2011)
Scalingapproachonmethaneemissions Test runs usingobservedsurfacemethaneconcentrations, comparingloss and emissions: Assumingequilibriumbetweenemissions and loss in 2000 results in thefollowingscalingfactorsofmethaneemissions: Bousquet (biomassburning+natural): 1.1041 Edgar 4.2 (anthropogenic): 1.0677: -> New emissions used in model runs:
Non-methaneemssions and other input data in simualtion Anthropogenic: 1970-2008 Edgar 4.2 Biomassburning: 1997-2011 GFED, all otheryearsuse GFED 2000 Natural: 2000 Megan, all otheryearsuse MEGAN 2000 Meteorology: 1997-2012, all otheryearsuseyear 2000 Stratosphericconcentrationsozonedepletingsubstances: Strat 2d data introduced in runs from 1980 and onwards.
3 ratherdistinctperiods in thelevelofsophiticationofmodel runs 1970-1984: Kind of test/spinup. Onlychanges in anthropogenicemissionstakenintoaccount. Fewmethanemeasurements/no global network to comparewith. 1984-1997: Variationalso in methaneemissions from biomassburning and naturalsources. More methaneobservations to comparewith 1997-2008: Variationalso in non-methanebiomassburningemissions and meteorology. Numerousmethaneobservations to comparewith.
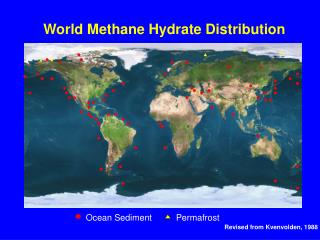
Comparisonobservations Availablesurfacestations at WDCGG " • " denotes that the data from the station has been updated in the last 365 days
Jan 2008 Methane (ppbv) in lowestmodellayer in CTM3 compared to observations (circles) Jul 2008
Examples: Portionofcomparisons for stations for theperiod 2003-2012
ppbv Months
ppbv Days
Jan 2001- Oct 2012 ppbv ppbv Days In line with isotope studies for selected periods during 2008 and 2009 (Fischer et al. (2011)) Arctic summer CH4 source in 2008 and 2009 was from wetlands. During winter time fossil gas emissions dominated the CH4 input. Submarine emissions along the West Spitsbergen slope was found to have negligible CH4 input to the atmosphere in summer, despite the fact that it was possible to identify methane bubbles in the sea from the sea floor. GAME project isotope instrument installed and measurements available since beginning of 2012.
Possible reasons that the model simulation has a larger growth rate for recent years than the observations: Bergamschi et al 2013, inversion study: “For all inversions, the derived overall trend of the anthropogenic emissions is smaller than the trend in the EDGARv4.2 emission inventory” “Bousquet et al. 2011 attribute the increase in total emissions largely to wetlands while in our study, a substantial fraction of the total increase is attributed to anthropogenicemissions»
Remainingwork/future plans • A lot of material for furtheranalysis . • - Furthercomparisonsurfaceobservations • - Further studies onmethanetracers from the different emissionsectors • - Comparisonsatellites (IASI, Sciamachy,…) and verticalprofiles ? • - Isotopes in OsloCTM3 ?? • More tests with different emissions for theperiod 2006/2009-2013 ?? • - Test more assumptionsondevelopmentnatural and anthropogenicemissionsafter 2009 (periodoflackingemission data in currentsimulations) • - Test furtherwithhydrateemissions from ESS. • Complete the «constantmethane» simulation to reveal theeffectof CO, NOx, NMVOC, Strat O3,...... changesonmethaneoxidationthrough OH. • Setup and simulationswithfuturerealisticemission scenario(s) (WP 3 in GAME)
Gas Entericfermentation Biomassburning Energy Rice/soil • Surfacemethanechange (ppbv) 2006-2007 Oil Solid fuels Wetlands