Download
1 / 19
240 likes | 476 Vues
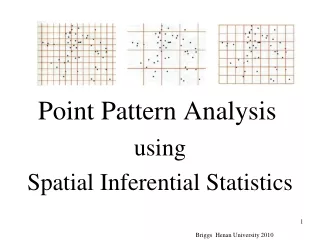
Point Pattern Analysis. Chapter 4 Geographic Information Analysis By David O’ Sullivan and David J. Unwin. Introduction to Point Pattern Analysis. Simplest Possible Spatial Data -A point pattern is a set of events in a study region -Each event is symbolized by a point object

E N D
Point Pattern Analysis Chapter 4 Geographic Information Analysis By David O’ Sullivan and David J. Unwin
Introduction to Point Pattern Analysis • Simplest Possible Spatial Data -A point pattern is a set of events in a study region -Each event is symbolized by a point object -Data are the locations of a set of point objects • Applications -Hot-spot analysis (crime, disease) -Vegetation, archaeological studies
Introduction to Point Pattern Analysis • Requirements for a set of events to constitute a point pattern -Pattern should be mapped on a plane -Study area determined objectively -Pattern is a census of the entities of interest -One-to-one correspondence between objects and events -Event locations are proper
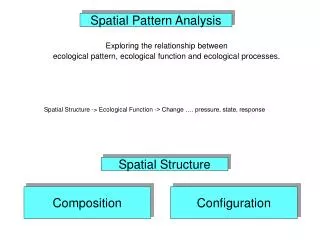
Point Density -First-order effect: Variation of intensity of a process across space -Number of events per unit area -Absolute location Point Separation -Second-order effect: Interaction between locations based on distance between them -Relative location Introduction to Point Pattern Analysis • Describing a point pattern
Introduction to Point Pattern Analysis • Descriptive statistics to provide summary descriptions of point patterns -Mean center -Standard Distance
Density-Based Point Pattern Measures • First-order effect • Sensitive to the definition of the study area
Density-Based Point Pattern Measures • Quadrant count methods -Record number of events of a pattern in a set of cells of a fixed size -Census vs. Random
Density-Based Point Pattern Measures • Kernel-density estimation -Pattern has a density at any location in the study region -Good for hot-spot analysis, checking first-order stationary process, and linking point objects to other geographic data Naive method
Distance-Based Point Pattern Measures • Second-order effect • Nearest-neighbor distance -The distance from an event to the nearest event in the point pattern • Mean nearest-neighbor distance -Summarizes all the nearest-neighbor distances by a single mean value -Throws away much of the information about the pattern
Distance-Based Point Pattern Measures • G function -Simplest -Examines the cumulative frequency distribution of the nearest-neighbor distances -The value of G for any distance tells you what fraction of all the nearest-neighbor distances in the pattern are less than that distance
Distance-Based Point Pattern Measures • F function -Point locations are selected at random in the study region and minimum distance from point location to event is determined -The F function is the cumulative frequency distribution -Advantage over G function: Increased sample size for smoother curve
Distance-Based Point Pattern Measures • K function -Based on all distances between events -Provides the most information about the pattern
Distance-Based Point Pattern Measures • Problem with all distance functions are edge effects • Solution is to implement a guard zone
Assessing Point Patterns Statistically • Null hypothesis -A particular spatial process produced the observed pattern (IRP/CSR) • Sample -A set of spatial data from the set of all possible realizations of the hypothesized process • Testing -Using a test to illustrate how probable an observed value of a pattern is relative to the distribution of values in a sampling distribution
Assessing Point Patterns Statistically • Quadrant counts -Probability distribution for a quadrant count description of a point pattern is given by a Poisson distribution -Null hypothesis: (IRP/CSR) -Test statistic: Intensity (λ) -Tests: Variance/mean ratio, Chi-square • Nearest-neighbor distances -R statistic
Assessing Point Patterns Statistically • G and F functions -Plot observed pattern and IRP/CSR pattern
Assessing Point Patterns Statistically • K function -Difficult to see small differences between expected and observed patterns when plotted -Develop another function L(d) that should equal zero if K(d) is IRP/CSR -Use computer simulations to generate IRP/CSR (Monte Carlo procedure)
Critiques of Spatial Statistical Analysis • Peter Gould -Geographical data sets are not samples -Geographical data are not random -Geographical data are not independent random -n is always large so results are almost always statistically significant -A null hypothesis of IRP/CSR being rejected means any other process is the alternative hypothesis • David Harvey -Altering parameter estimates by changing study region size often can alter conclusions