Download
1 / 36
360 likes | 371 Vues
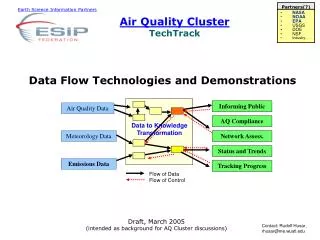
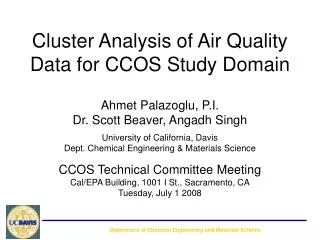
Department of Chemical Engineering and Materials Science. Cluster Analysis of Air Quality Data for CCOS Study Domain. Scott Beaver Ahmet Palazoglu, P.I. University of California, Davis Dept. Chemical Engineering & Materials Science CCOS Technical Committee Meeting

E N D
Department of Chemical Engineering and Materials Science Cluster Analysis of Air Quality Data for CCOS Study Domain Scott Beaver Ahmet Palazoglu, P.I. University of California, Davis Dept. Chemical Engineering & Materials Science CCOS Technical Committee Meeting Cal/EPA Building, 1001 I St., Sacramento, CA Thursday 31 March 2007
Department of Chemical Engineering and Materials Science Overview • Project: Cluster Analysis for CCOS Domain • Intra-basin analyses: wind patterns & synoptic regimes • Inter-basin meteorological response of O3 levels • Intra-basin analyses: • Completed Bay Area analysis • Strong synoptic influence; seabreeze cycles • Preliminary North SJV wind field clustering • Synoptic & ventilation effects • Preliminary Central SJV wind field clustering • Synoptic & mesoscale (Fresno eddy) effects • Preliminary South SJV wind field clustering • Synoptic effects; mesoscale variability difficult to capture • Initial Sacramento Valley & Mountain Counties analysis • Future work and recommendations
Department of Chemical Engineering and Materials Science Cluster Analysis for CCOS • Scope of 2-year project • Intra-basin wind field cluster analyses • Requires continuous, hourly surface wind data • Days grouped by diurnal wind field patterns • Reveals synoptic and mesoscale flow regimes • Inter-basin analysis • Study Domain • 6 CCOS air basins • San Francisco Bay Area • SJV: split into North, Central, & South • Sacramento Valley • Mountain Counties • 1996-2004 ozone seasons (1 May – 31 October)
San Francisco Bay Area Department of Chemical Engineering and Materials Science
Department of Chemical Engineering and Materials Science SFBA: 4 clusters for 976 days *Beaver and Palazoglu, 2006: Cluster analysis of hourly wind measurements to reveal synoptic regimes affecting air quality. Journal of Applied Meteorology and Climatology, 45, 1710—26.
Department of Chemical Engineering and Materials Science SFBA clusters = synoptic regimes R H Onshore High: 353 d, 13% episodes Offshore High: 86 d, 13% episodes Weaker Trough: 309 d, 0% episodes Deeper Trough: 309 d, 0% episodes V1 V2
Department of Chemical Engineering and Materials Science Synoptic Transition Probabilities • R transitions rapidly to H • Severe, multi-day episodes • Reverse HR does not occur • Polar low may “save” SFBA from episode • Persistence of H indicates stability • Displaced by sufficiently deep trough (e.g. V2) • Bulk of episodes during persistent H • Transitions from V1 & V2 driven by global met. • Troughs may persist for long periods; low O3 levels • Transition to H or R will occur unless O3 season ends *Beaver, Palazoglu and Tanrikulu, 2007: Cluster sequencing to analyze synoptic transitions affecting regional ozone. Journal of Applied Meteorology and Climatology, in press.
Department of Chemical Engineering and Materials Science SJV SLAMS network
Department of Chemical Engineering and Materials Science SLAMS, CIMIS, RAWS & NCDC
Department of Chemical Engineering and Materials Science North SJV Wind Monitors
Department of Chemical Engineering and Materials Science Wind Speed Errors at Tracy 1996—1999 are similar to 2001—2004.
Department of Chemical Engineering and Materials Science Wind Direction Errors at Tracy 1996—1999 are similar to 2001—2003.
Department of Chemical Engineering and Materials Science Gantt chart for N-SJV Yellow = 1 Nov—30 Apr winter data (not clustered) Blue = clustered stations (included in Total) Red = non-clustered stations (excluded from Total)
Department of Chemical Engineering and Materials Science R V H H H: 179 days, 42% H/V: 212 days, 25% R: 264 days, 19% V1: 299 days, 12% V2: 108 days, 6% V1 V2
Department of Chemical Engineering and Materials Science N-SJV 0900 PST Wind Field R H H/V V1 V2 Increasing marine ventilation: R < H < H/V < V1 < V2 Magenta: Carquinez Strait— Ft. Funston, Pt. San Pablo, Suisun, Bethel Is. Blue: Altamont Pass— Kregor Peak, Tracy Red: Pacheco Pass— Los Banos Black: SJV floor
Department of Chemical Engineering and Materials Science N-SJV Seasonal Distribution R H H/V V1 V2
Department of Chemical Engineering and Materials Science N-SJV Ventilation
Department of Chemical Engineering and Materials Science Altamont Pass Wind Distribution
N-SJV Synoptic Sequencing • a = 0.05 • RH/V disfavored • Clusters occur in different seasons (trivial result) • a = 0.15 • RH favored • HH/V favored • H/VV favored • VR favored • Compare to Bay Area • Transitions significant at a < 0.02 • Stronger synoptic influence than N-SJV
Department of Chemical Engineering and Materials Science Central SJV Wind Monitors
Department of Chemical Engineering and Materials Science Annual Biases in Wind Direction 2000—02 are ~15o more westerly than other years.
Department of Chemical Engineering and Materials Science Upslope/Downslope Cycle Wind direction at SLAMS Sequoia monitor for 20 days during 2003. Flow switches from easterly to westerly. Daytime upslope flows; nighttime drainage flows Diurnal cycle largely captures local effects. Signal is not well modeled by clustering algorithm.
Department of Chemical Engineering and Materials Science Gantt chart for C-SJV Magenta: stations with annual biases
Department of Chemical Engineering and Materials Science V R H H H: 203 days H/V: 169 days R: 341 days V: 279 days V/I: 378 days I V? V
Department of Chemical Engineering and Materials Science C-SJV 8-hr O3 Exceedances Percentage of days in each cluster that are 8-hr O3 exceedances H R V V/I H/V Ventilated regime episodes favor Sequoia. Anti-cyclonic regime episodes favor SJV floor.
Department of Chemical Engineering and Materials Science C-SJV Seasonal Distribution R H H/V V/I V
Department of Chemical Engineering and Materials Science C-SJV Synoptic Sequencing • Direct transitions between H, R, and V occur infrequently • H/V and V/I are “intermediate” states • C-SJV is buffered from synoptic effects • Synoptic transitions have less effect on O3 levels than for N-SJV (than for Bay Area) • Mesoscale effects important for C-SJV
Department of Chemical Engineering and Materials Science The Fresno Eddy H R H/V V V/I Decreasing eddy strength: H > R > H/V > V > V/I Magenta: Carquinez Strait— Ft. Funston, Pt. San Pablo, Suisun Blue: Altamont Pass— Kregor Peak, Tracy Red: Pacheco Pass— Los Banos Cyan: Parkfield (west) & Sequoia (east) Yellow: Carrizo Plain
Department of Chemical Engineering and Materials Science Eddy Strength and O3 Levels No/weak eddy Strong eddy ? H R H/V V V/I
Department of Chemical Engineering and Materials Science Eddy Strength & Marine Ventilation H R H/V V V/I Within each regime, enhanced marine ventilation can suppress eddy formation
Department of Chemical Engineering and Materials Science South SJV Wind Monitors
Department of Chemical Engineering and Materials Science Gantt chart for S-SJV
Department of Chemical Engineering and Materials Science V R H H H/V: 206 days, 64% H: 354 days, 58% R: 373 days, 62% V: 160 days, 36% V/I: 317 days, 22% I? V V
Department of Chemical Engineering and Materials Science S-SJV Seasonal Distribution H/V H R V V/I
Department of Chemical Engineering and Materials Science Progress Non-contracted quality assurance is a critical but time consuming step which has delayed Phase I progress.
Department of Chemical Engineering and Materials Science Recommendations • Transport analysis for identified met regimes using a (back-trajectory) transport model. • Transport through gaps in Coastal Range • Transport patterns from major source areas • NOx/VOC ratio and O3 sensitivity • Role of meteorology • El Nino effects • Wild fire analysis • Vertical analysis • Visalia profiler • Limited soundings? • AQM performance evaluation • … and others from project work plan ???