Download
1 / 13
130 likes | 136 Vues
This presentation summarizes the clustering analysis work conducted for the CCOS study domain, focusing on 6 subdomains and the analysis of wind and ozone measurements. The presentation discusses the qualitative agreement of results between subdomains, synoptic influences, and data limitations. Lessons learned and practical applications of clustering for modeling efforts are also highlighted.

E N D
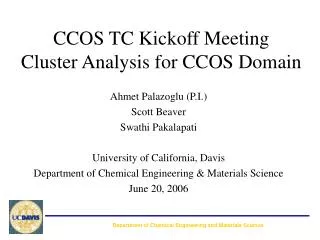
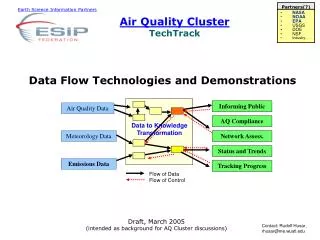
Department of Chemical Engineering and Materials Science Cluster Analysis of Air Quality Data for CCOS Study Domain Ahmet Palazoglu, PI University of California, Davis, CA Presented by Scott Beaver Bay Area Air Quality Management District CCOS TC Meeting 4 November 2008 EPA Building, Sacramento, CA
Department of Chemical Engineering and Materials Science 3 Purposes of Presentation • Summary of clustering work for CCOS domain • 6 subdomains: Bay Area, San Joaquin Valley (North, Central, and South), Sacramento Valley & Mountain Counties • 1996-2004 “extended” ozone seasons (1 May -- 31 Oct) • Separate clusterings of wind & O3 measurements • Domain-wide analysis • Qualitative agreement of results between subdomains • Similar synoptic influences for all subdomains • Example episodic scenario affecting entire domain • Quantitative analysis not feasible • Data limitations • Extensions of methods • Practical applications for modeling (simulation) efforts • Proofs of concept demonstrated for SFBA
Department of Chemical Engineering and Materials Science Work Plan Tasks • Wind field clustering for 6 CCOS subdomains • Collect data • Non-contracted but necessary quality assurance delayed overall contract progress • Perform 6 independent clusterings: SFBA, N/C/S SJV, SV, MC • Interpret clustering results • O3 clustering for 6 CCOS subdomains • Collect data • Test alternative algorithms for SFBA • Perform clusterings for other 5 subregions: N/C/S SJV, SV, MC • Interpret clustering results • Sequencing of dynamic cluster patterns • Attempt to relate wind and O3 clusterings • Identify recurring upper-atmospheric transitions • Consider dynamics at other time scales • Domain-wide synopsis of wind field clusterings • Data limitations precluded quantification of these results
Department of Chemical Engineering and Materials Science Lessons Learned • Wind field clustering & sequencing contribute significant information • Provide physical insight for CCOS domain ozone episodes • Can provide increased representativeness and confidence in modeling (simulation) efforts • Methods useful for winter PM analysis (ongoing BAAQMD contract) • Multi-scale nature of CCOS domain ozone variability • Mesoscale flow features further refine synoptically oriented clusters • Sources of inter-annual variability are not easily resolved • Complexity of meteorology varies by basin • SFBA least complex • Slight amount of marine ventilation inhibits ozone buildup • Sacramento Valley most complex • Bi-directional flows along valley major axis • Small changes in marine ventilation (not affecting other basins) may strongly impact ozone levels • SJV has considerable spatial variability • Thermal flows stronger deeper south into SJV; marine influences stronger toward north • Fresno Eddy generates very complex but localized flow patterns • Novel quality assurance methods were developed and applied to significantly enhance the results • O3 measurements clustering is not very useful • Data limitations unknown at project outset precluded quantitative domain-wide analysis • Study could have been designed to focus on domain-wide patterns at expense of lost detail for individual subdomains
Department of Chemical Engineering and Materials Science Consistent clusters for 5 subdomains Number of days (and % NAAQS 8-hr O3 exceedances) for each cluster, by subdomain.
Department of Chemical Engineering and Materials Science “Static” cluster patterns (500-hPa) R V H H R H/V H Similar synoptic influences for all subdomains, but surface flows vary considerably. V or V1 V/I or V2 V
Department of Chemical Engineering and Materials Science “Dynamic” cluster sequences (500-hPa) Example: VRH captures eastward sweeping Rossby wave Trough along coast buffers CCOS domain from effects of offshore high pressure systems Trough dissipates as offshore high pressure advances eastward Ridge forms along coast from high pressure of offshore origin
Department of Chemical Engineering and Materials Science “Dynamic” cluster sequences (surface)
Department of Chemical Engineering and Materials Science Domain-wide Hypothetical Example Tradeoff between spatial and temporal resolution for each subdomain. Only 452 of 1656 days in cluster analysis have labels for all subdomains! Lowered spatial resolution could increase domain-wide sample sizes.
Department of Chemical Engineering and Materials Science Practical Extensions of Clustering • Winter PM season clustering & sequencing • BAAQMD contract with UC Davis provides proof of concept • Initial results useful for modeling efforts • Meteorological & Air Quality Model (AQM) validation • Classify simulated winds among known patterns • Determine if simulated data (classification) are labeled consistently with observations (clustering) • Prevailing conditions • Upper-atmospheric transitions • Expect better AQM performance when met. modeled accurately • Determine if seasonal met model can explain air quality variability • Proof of concept for MM5 winter 2000-01 simulation at BAAQMD • Compare MM5 performance to different met. models (WRF, CALMET) • Selection of representative conditions for future simulations
Department of Chemical Engineering and Materials Science MM5 validation: SFBA example First half of CRPAQS episode: R1R2R3R1 realistically simulated. Second half of CRPAQS episode: persistent R2 inaccurately simulated as R1. Simulated ventilation arrives 1-2 days early. The 12/17/2000-1/7/2001 CRPAQS study period is simulated using MM5. This period was included in a previous UC Davis cluster analysis.
Department of Chemical Engineering and Materials Science CMAQ performance evaluation Last day: PM levels decrease too early for eastern sites Second half: PM levels underestimated. First half: adequate performance