Download
1 / 51
520 likes | 731 Vues
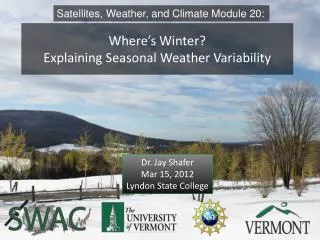
Satellites, Weather, and Climate Module 20:. Where’s Winter? Explaining Seasonal Weather Variability. Dr. Jay Shafer Mar 15, 2012 Lyndon State College. Outline. Winter 2012 Rankings Possible Culprits AO (Arctic Oscillation) ENSO (El Nino Southern Oscillation )

E N D
Satellites, Weather, and Climate Module 20: Where’s Winter? Explaining Seasonal Weather Variability Dr. Jay Shafer Mar 15, 2012 Lyndon State College
Outline • Winter 2012 Rankings • Possible Culprits • AO (Arctic Oscillation) • ENSO (El Nino Southern Oscillation) • Climate Change Considerations
Temperature Anomaly: November to February 2012 Persistent warm over critical cold air source regions Units: Degrees Celsius
Snowfall Ranks Mt. Mansfield Oct 1 – Mar 12 Snowfall Burlington Oct 1 – Mar 12 Snowfall Records back to 1943 Records back to 1954
Temperature Ranks: Average Mean Temperature Nov 1- Mar 12 Montpelier Burlington St. Johnsbury Records back to 1948 Records back to 1940 Records back to 1894
Seasonal Variability Largest one year difference Burlington, VT, Seasonal Snowfall Nov 1– Mar 14 How can one explain year-to-year variations?
Arctic Oscillation • Describes high latitude pressure pattern oscillations (atmospheric oscillation) • Derived from principal pattern of variability in low tropospheric (low level) atmospheric pressure patterns • Most influential during winter season • Can help to lock in long-lived (weeks to months) patterns that influence seasonal conditions • Predictable one to two weeks ahead
Anomaly pattern associated with Arctic Oscillation (AO) Positive Arctic Oscillation State Lower heights and colder temperatures Higher heights and warmer temperature Source: http://www.cpc.ncep.noaa.gov/products/precip/CWlink/daily_ao_index/loading.html
Surface Temperature Anomaly (Deg C) +5 to +10 days after (–) AO transitions Increased cold risk
AO Negative Phase Conditions Slightly wetter Colder temperatures Source: http://www.cpc.noaa.gov/research_papers/ncep_cpc_atlas/8/table_ao.html
AO Positive Phase Conditions Drier Warmer temperatures Source: http://www.cpc.noaa.gov/research_papers/ncep_cpc_atlas/8/table_ao.html
AO Year-to-Year Variability Blue: Winter 2011-12 Red: Winter 2010-11
What causes the AO to be positive one December and negative another? We don’t fully understand – it’s very complex! NASA: http://earthobservatory.nasa.gov/IOTD/view.php?id=77076&src=eoa-iotd
Observed AO (solid line) and Forecasts (Red lines) http://www.cpc.ncep.noaa.gov/products/precip/CWlink/daily_ao_index/ao_index_ensm.shtml
EL Nino – Southern Oscillation • Oceanic oscillation of equatorial sea surface temperatures (SST) in Pacific Ocean • Southern Oscillation: refers to atmospheric response to oceanic fluxes of heat and moisture (oceans lead the atmosphere) • Largest and most significant oscillation of SSTs in the world • Has significant impacts on global circulation
Source: http://www.cpc.ncep.noaa.gov/products/analysis_monitoring/ensocycle/enso_cycle.shtml
Example La Nina (cold phase) Conditions Nino 3 Region Nino 4 Region Nino 1.2 Region Temperature Anomaly (Degrees Celsius)
Source: http://www.cpc.ncep.noaa.gov/products/analysis_monitoring/ensocycle/enso_cycle.shtml
Example El Nino (warm phase) Conditions Temperature Anomaly (Degrees Celsius)
Source: http://www.cpc.ncep.noaa.gov/products/analysis_monitoring/ensocycle/enso_cycle.shtml
El Nino Winter Jet Stream Wind Anomaly Top 10 El Niños since 1973 Stronger Jet Weaker Jet Units: m s-1
La Nina Winter Jet Stream Wind Anomaly Top 10 La Niñassince 1970-2010 Weaker Jet Stronger Jet Units: m s-1
Winter 2011-12 Jet Stream Speed Anomaly Typical La Nina pattern, but note strong jet in Pac NW Units: m s-1
Winter Mean Jet Stream Positions Red: Strong El Nino: Blue Strong La Nina Green: Winter 2011-12 La Nina this winter.
El Nino: La Nina: Source: NOAA- http://www.cpc.noaa.gov/products/analysis_monitoring/ensostuff/ensofaq.shtml#GLOBALimpacts
Winter Snowfall Anomalies: La Nina Conditions Above average Below average NOAA: http://www.cpc.noaa.gov/products/analysis_monitoring/lanina/us_impacts/ustp_impacts.shtml#NVC
Winter Snowfall Anomalies: El Nino Conditions Below average Above average NOAA: http://www.cpc.noaa.gov/products/analysis_monitoring/lanina/us_impacts/ustp_impacts.shtml#NVC
Winter Air Temperature Anomalies Last 10 Years Warming is occurring rapidly at high latitudes.
Betts 2011 http://journals.ametsoc.org/doi/full/10.1175/2011WCAS1096.1?prevSearch=[Contrib%3A+alan+betts]&searchHistoryKey=
Nino3.4 vs Burlington Winter Snowfall La Ninas El Ninos 3: Above 1: Below 4: Above 2: Below
Nino3.4 vs Burlington Winter Snowfall La Nina + Snow N=6 El Nino + Snow N=6 La Nina - Snow N=5 El Nino - Snow N=3
Nino3.4 vs. Burlington Winter Temperatures El Ninos La Ninas 4: Above 3: Below 5: Above 2: Below
Nino3.4 vs. Burlington Winter Temperatures La Nina Warm N=7 El Nino Warm N=6 El Nino Cold N=4 La Nina Cold N=3
ENSO Conclusions • A lot of spread, ENSO does not explain much of the variability • Other factors must be at play, complex interactions of tropics and high latitudes • Slight tendency for snowier winters to be associated with La Ninas (top 3 winters were La Nina winters), however this year is an exception