Download
1 / 1

E N D
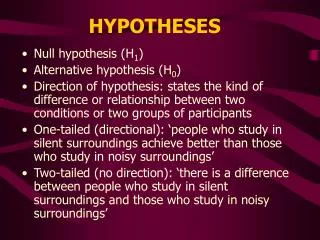
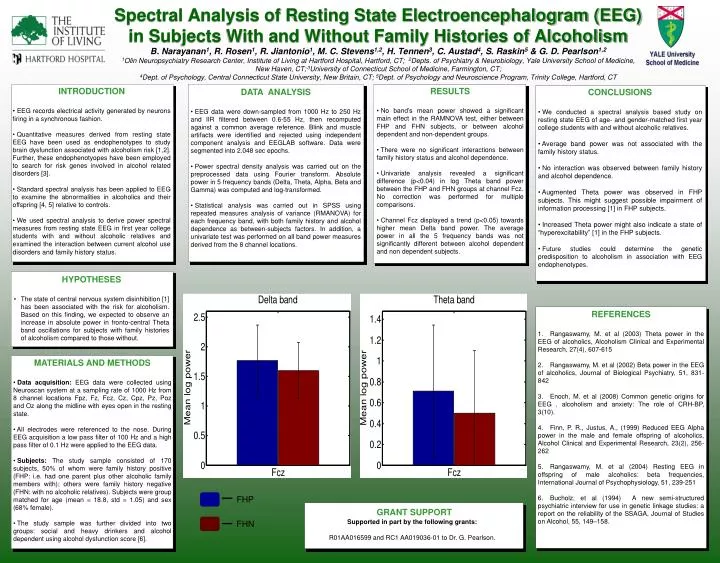
Spectral Analysis of Resting State Electroencephalogram (EEG) in Subjects With and Without Family Histories of AlcoholismB. Narayanan1, R. Rosen1, R. Jiantonio1, M. C. Stevens1,2, H. Tennen3, C. Austad4, S. Raskin5 & G. D. Pearlson1,21Olin Neuropsychiatry Research Center, Institute of Living at Hartford Hospital, Hartford, CT; 2Depts. of Psychiatry & Neurobiology, Yale University School of Medicine, New Haven, CT;3University of Connecticut School of Medicine, Farmington, CT; 4Dept. of Psychology, Central Connecticut State University, New Britain, CT; 5Dept. of Psychology and Neuroscience Program, Trinity College, Hartford, CT • INTRODUCTION • EEG records electrical activity generated by neurons firing in a synchronous fashion. • Quantitative measures derived from resting state EEG have been used as endophenotypes to study brain dysfunction associated with alcoholism risk [1,2]. Further, these endophenotyopes have been employed to search for risk genes involved in alcohol related disorders [3]. • Standard spectral analysis has been applied to EEG to examine the abnormalities in alcoholics and their offspring [4, 5] relative to controls. • We used spectral analysis to derive power spectral measures from resting state EEG in first year college students with and without alcoholic relatives and examined the interaction between current alcohol use disorders and family history status. • MATERIALS AND METHODS • Data acquisition: EEG data were collected using Neuroscan system at a sampling rate of 1000 Hz from 8 channel locations Fpz, Fz, Fcz, Cz, Cpz, Pz, Poz and Oz along the midline with eyes open in the resting state. • All electrodes were referenced to the nose. During EEG acquisition a low pass filter of 100 Hz and a high pass filter of 0.1 Hz were applied to the EEG data. • Subjects: The study sample consisted of 170 subjects, 50% of whom were family history positive (FHP: i.e. had one parent plus other alcoholic family members with); others were family history negative (FHN: with no alcoholic relatives). Subjects were group matched for age (mean = 18.8, std = 1.05) and sex (68% female). • The study sample was further divided into two groups: social and heavy drinkers and alcohol dependent using alcohol dysfunction score [6]. • CONCLUSIONS • We conducted a spectral analysis based study on resting state EEG of age- and gender-matched first year college students with and without alcoholic relatives. • Average band power was not associated with the family history status. • No interaction was observed between family history and alcohol dependence. • Augmented Theta power was observed in FHP subjects. This might suggest possible impairment of information processing [1] in FHP subjects. • Increased Theta power might also indicate a state of “hyperexcitability” [1] in the FHP subjects. • Future studies could determine the genetic predisposition to alcoholism in association with EEG endophenotypes. • HYPOTHESES • The state of central nervous system disinhibition [1] has been associated with the risk for alcoholism. Based on this finding, we expected to observe an increase in absolute power in fronto-central Theta band oscillations for subjects with family histories of alcoholism compared to those without. Supported in part by the following grants: R01AA016599 and RC1 AA019036-01 to Dr. G. Pearlson. • GRANT SUPPORT • REFERENCES • Rangaswamy, M. et al (2003) Theta power in the EEG of alcoholics, Alcoholism Clinical and Experimental Research, 27(4), 607-615 • Rangaswamy, M. et al (2002) Beta power in the EEG of alcoholics, Journal of Biological Psychiatry, 51, 831-842 • Enoch, M. et al (2008) Common genetic origins for EEG , alcoholism and anxiety: The role of CRH-BP, 3(10). • Finn, P. R., Justus, A., (1999) Reduced EEG Alpha power in the male and female offspring of alcoholics, Alcohol Clinical and Experimental Research, 23(2), 256-262 • Rangaswamy, M. et al (2004) Resting EEG in offspring of male alcoholics: beta frequencies, International Journal of Psychophysiology, 51, 239-251 • Bucholz, et al (1994) A new semi-structured psychiatric interview for use in genetic linkage studies: a report on the reliability of the SSAGA, Journal of Studies on Alcohol, 55, 149–158. • RESULTS • No band’s mean power showed a significant main effect in the RAMNOVA test, either between FHP and FHN subjects, or between alcohol dependent and non-dependent groups. • There were no significant interactions between family history status and alcohol dependence. • Univariate analysis revealed a significant difference (p<0.04) in log Theta band power between the FHP and FHN groups at channel Fcz. No correction was performed for multiple comparisons. • Channel Fcz displayed a trend (p<0.05) towards higher mean Delta band power. The average power in all the 5 frequency bands was not significantly different between alcohol dependent and non dependent subjects. • DATA ANALYSIS • EEG data were down-sampled from 1000 Hz to 250 Hz and IIR filtered between 0.6-55 Hz, then recomputed against a common average reference. Blink and muscle artifacts were identified and rejected using independent component analysis and EEGLAB software. Data were segmented into 2.048 sec epochs. • Power spectral density analysis was carried out on the preprocessed data using Fourier transform. Absolute power in 5 frequency bands (Delta, Theta, Alpha, Beta and Gamma) was computed and log-transformed. • Statistical analysis was carried out in SPSS using repeated measures analysis of variance (RMANOVA) for each frequency band, with both family history and alcohol dependence as between-subjects factors. In addition, a univariate test was performed on all band power measures derived from the 8 channel locations. FHP FHN