Download

1 / 45
450 likes | 613 Vues
Hypotheses. 9/4/2012. Readings. Chapter 1 The Measurement of Concepts (14-23) (Pollock ) Chapter 2 Measuring and Describing Variables (Pollock) (pp.28-31). Opportunities to discuss course content. Office Hours For the Week. When Wednesday 11-1 Thursday 8-12 And by appointment.

E N D
Hypotheses 9/4/2012
Readings • Chapter 1 The Measurement of Concepts (14-23) (Pollock) • Chapter 2 Measuring and Describing Variables (Pollock) (pp.28-31)
Office Hours For the Week • When • Wednesday 11-1 • Thursday 8-12 • And by appointment
Course Learning Objectives • Students will learn the research methods commonly used in behavioral sciences and will be able to interpret and explain empirical data. • Students will learn the basics of research design and be able to critically analyze the advantages and disadvantages of different types of design.
Turning things empirical • We experience it • We Define it • We give it value (operationalize) • We develop a hypothesis to explain/predict what we experienced in step 1
How we measure our Variables Units of Analysis
Units of analysis • The unit about which information is collected and that provides the basis of analysis • Each member of a population is an element • Why they are important?
Individual Unit • The lowest form of data • People, congressmen, presidents, etc
Aggregate Data • A collection of individual level units • Often measured in percentages • Footprints
Ecological Fallacy • this arises when an aggregate/ecological level phenomenon is used to make inferences at the individual level. • Taking statewide data and applying to individuals • Does everyone in MS go to church?
The Exception Fallacy • taking one person's behavior, attributes, etc and applying it to an entire group • Using 1 example to define group behavior
What Is a Hypothesis • An educated Guess • These are explicit Statements • They Try to explain a relationship • But they are only tentative until tested
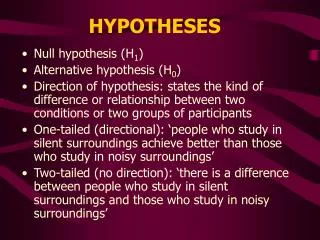
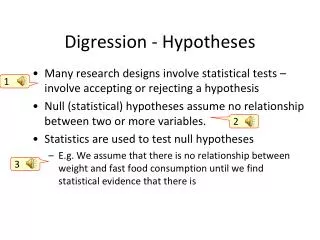
The Null Hypothesis • The Statement of No Relationship • What we want to disprove • The Basic start of research H0
Correlative Hypothesis • “there is a relationship between x and y” • A very weak statement
Positive Hypothesis • A directional hypothesis • “as the independent variable increases, the dependent variable increases”
Negative Relationship/Hypothesis • “As the independent variable increases, the dependent variable decreases” • Also called an inverse hypothesis
Logarithmic • Y=log(x) • The dependent variable changes rapidly, followed by less change
Curvilinear • The Relationship forms a curve! • The dependent variable increases to a point, and which point it begins to decrease
The Laffer Curve • The Debate over taxes • Ben Stein
Hulk Hogan • Roddy Piper (4:44) • King Kong Bundy (2:56)
Stating a hypothesis There is a _____(direction)________relationship between ________and ____________
Good Hypotheses are Empirical • Something that we can Measure
Good Hypothesis are Generalizable Specific Always State a direction Always identify the iv and the d.v. Avoid the correlative hypothesis • Apply to more than one case
Good Hypotheses are Plausible • There needs to be a Real world justification for why they are related • If Chewbacca lives on Endor, you must acquit
Good Hypotheses are Testable • You have to be able to test your hypothesisor it is just speculation.
Non-Tautological • Your independent and dependent variables are separate concepts
A Test of Scientific Knowledge A Causal Hypothesis
What is a causal hypothesis? • The Boldest Hypothesis out there • A relationship that will occur 100% at all times, no exceptions • Difficult to Prove
To Prove a Causal Hypothesis • A Change in the Independent Variable will always cause a change in the dependent variable. • A change in X always precedes a change in Y • X is necessary and sufficient to cause a change in Y