Download
1 / 32
320 likes | 328 Vues
The Production Possibility Frontier. A model used to highlight and clarify scarcity , and issues such as efficiency , tradeoffs , opportunity cost and growth , which are associated with scarcity. allocative efficiency. productive efficiency. PPF: Efficiency ( Micro Focus Def’n ).

E N D
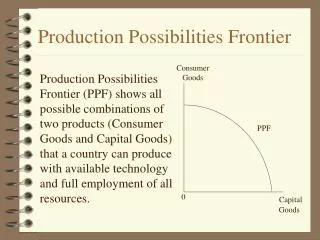
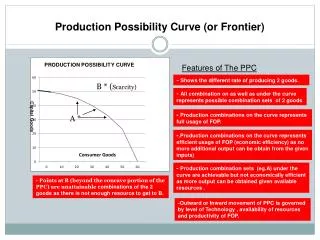
The Production Possibility Frontier • A model used to highlight and clarify scarcity, and issues such as efficiency,tradeoffs,opportunitycost and growth, which are associated with scarcity
allocative efficiency productive efficiency PPF: Efficiency(Micro Focus Def’n) • resources must be allocated to the production of goods & services that people want the most “getting the best mix” • production must be carried on in the least costly way
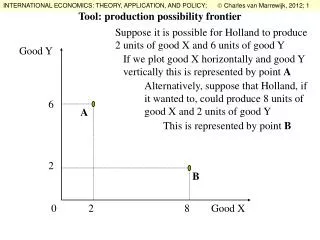
P.P.F. Assumptions • All resources (land, labour, capital, other) are used • Productive efficiency is achieved • Given point in time • Resources are fixed in quantity but can be shifted around • Technology doesn’t change • Only 2 goods are produced in this economy
Production possibilities of pizza & robots with full employment, yr. 2009 Production alternatives TYPE OF PRODUCTABCDE Pizza (in hundred thousands) 01234 Robots (in thousands) 109740
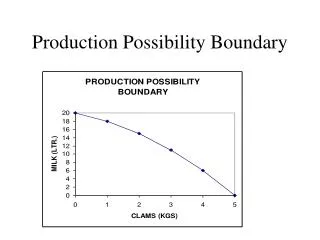
A B C D I E PPF Diagram 10 9 Any point on the frontier is Productively Efficient. It may or may not be Allocatively Efficient 8 7 6 Industrial Robots (1000’s) 5 4 3 Any point within the frontier is productively inefficient 2 1 1 2 3 4 5 6 7 8 Pizzas (100, 000’s)
PPF Highlights • The PPF is “bowed out”: • the opportunity cost (how much of one good is sacrificed to produce one of the other good) depends on how much of each the economy is producing • as more pizzas are produced the opportunity cost of pizzas in terms of robots increases
Production possibilities of pizza & robots with full employment, yr. 2006 Production alternatives TYPE OF PRODUCTABCDE Pizza (in hundred thousands) 01234 Robots (in thousands) 109740
A B C D E PPF Diagram 10 9 The opportunity cost of increasing Pizza production from 2 to 3 is 3,000 robots 8 7 6 The opportunity cost of increasing Pizza production from 3 to 4 4,000 robots Industrial Robots (1000s) 5 4 3 2 1 1 2 3 4 5 6 7 8 Pizzas (100, 000s)
PPF Highlights • This is the • Law of increasing relative cost • not all resources are equally productive in producing all things - resources are not perfect substitutes for each other; • that is, some resources have comparative advantage over other resources • Therefore opportunity costs increase for each additional good produced
A B C I D E PPF Diagram 10 Any point on the frontier is Productively Efficient. It may or may not be Allocatively Efficient 9 8 7 6 The more specialized the inputs,the more bowed out the frontier Industrial Robots (1000’s) 5 4 3 Any point within the frontier is productively inefficient 2 1 1 2 3 4 5 6 7 8 Pizzas (100, 000’s)
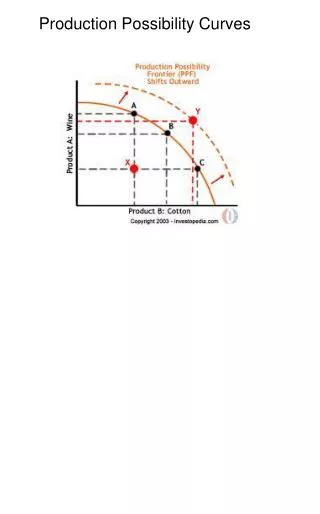
Change Assumptions • increase quantity &/or quality of resources growth • PPF shifts to the right • improve technologygrowth • PPF shifts to the right • decrease quantity &/or quality of resources negativegrowth • PPF shifts to the left • technology decrease negativegrowth • PPF shifts to the left
Old PPF New PPF Growth 10 9 Growth occurs when the Production Possibility Curve shifts to the right 8 7 6 Industrial Robots (1000s) 5 4 3 2 1 1 2 3 4 5 6 7 8 Pizzas (100, 000s)
Growth – Capital and Consumption Goods Consumption Goods -good produced primarily for consumption -bread, Xbox 360’s, TV shows -do not cause growth Capital Goods -goods that can be used to produce more goods -factories, universities, robots
PPF Highlights • Economic Growth results from • 1.) technological change and • 2.) capital accumulation (resource base) • The opportunity cost of faster economic growth is a decrease in current consumption • NOTICE the affect of present choices on future growth.
PPF, yr. 1998 Growth depends on the choices made today, a sacrifice of current consumption results in more capital today and “growth” in the future Growth 10 9 8 7 6 Industrial Robots (1000s) 5 4 3 2 PPF, yr. 2009 1 1 2 3 4 5 6 7 8 Pizzas (100, 000s)
Comparative Advantage:Specialization and Trade • Specialization and trade, and therefore markets that facilitate trade, make society better off by increasing the productivity of scarce resources • Comparative Advantage is the basis for the gains from specialization and trade
Mike’s Production Possibilities Carl’s Production Possibilities A B C A B C Wine (btls) 0 30 100 Beer (btls.) 1,000 700 0 0 40 80 80 40 0 Theory of Comparative Advantage: • Production Possibilities : • Carl and Mike: retired neighbours: hobbies are making wine and beer PPF’s for 1 month using same equipment and time..
Absolute Advantage • When a producer with of set of inputs can produce more output than another with the same inputs, the first producer has an absolute advantage in production of the output. • Carl has an absolute advantage in the production of both wine and beer.
Carl’s Proposition • “Since we are both being pressured to produce more, lets each of us do what we do best and trade. This will give each of us more than we now have without either of us working any harder.” • Notice that voluntary trade does not take place unless both parties benefit.
Mike’s Production Possibilities/ Opportunity Costs Bottles of beer In a month Mike can produce either 80 bottles of wine or 80 bottles of beer Opp cost of 80 wine is 80 beer Opp cost of 1 wine is 1 beer Opp cost of 80 beer is 80 wine Opp cost of 1 beer is………… 1000– 900– 825– 800– 700– 600– 500– 400– 300– 200– 175– 80– 40– • A B Consumption choice before trade • C • | | | | | | | | | | | 0 10 20 30 40 45 50 60 70 80 90 100 Bottles of wine
Carl’s Production Possibilities/ Opportunity Costs Bottles of beer Opp cost 100 wine is 1000 beer Opp Cost 1 wine is 10 beer Opp cost of 1000 beer is 100 wine Opp Cost 1 beer is………….. • A 1000– 900– 800– 700– 600– 500– 400– 300– 200– 100– B Consumption choice before trade • C • | | | | | | | | | | | 10 20 30 35 40 50 60 70 80 90 100 0 Bottles of wine
Comparative Advantage Opportunity Cost Table • When producer A has a lower opportunity cost of producing good A compared to another producer, then producer A is said to have a comparative advantage in the production of good A.
Comparative Advantage: Specialization • Carl has a “comparative advantage” (lowest opportunity cost producer) in the production of beer and therefore specializes in beer production. • Mike has a “comparative advantage” in the production of wine and therefore specializes in wine production • As long as opportunity costs differ, there is comparative advantage
Comparative Advantage: Specialization Theory of Comparative Advantage • if specialization takes place according to comparative advantage (the lowest opportunity cost producer) and then trade takes place…. both parties can benefit: that is, move outside their current PPF’s.
Carl & Mike After Specialization, but Before Trade Total Production & Consumption Total Gains Carl Produces & Can Consume Mike Produces & Can Consume + = Wine (btls.) Beer (btls.) +10 +260 0 1,000 80 0 80 1,000 Carl & Mike Before Specialization & Trade Carl Produces & Consumes Mike Produces & Consumes Total Consumption + = Wine (btls.) Beer (btls.) 30 700 40 40 70 740
Trade: The Benefits of Specialization • Carl proposes, after specialization, that he trade Mike 175 beer for 35 wine. (terms of trade: 5 beer for 1 wine) • Carl gets wine for a reduced sacrifice • 35 wine for 175 beer instead of 350 beer, the opportunity cost before trade • Mike gets beer for a reduced sacrifice • 175 beer for 35 wine instead of 175 wine, the opportunity cost before trade
Terms of Trade: 1 Wine for 5 Beer • Since voluntary trade requires that both parties benefit from the trade. • Before trade: • Carl: 1 wine “trades” for 10 beer • Mike: 1 wine trades for 1 beer Carl is better off as he now only has to give up 5 beer for a wine After trade 1 wine “trades” for 5 beer Mike is better off as he now only has to give up 1/5 wine for a beer • The Terms of Trade are between the personal ones that exist before trade, thus producing gains for both parties participating in the trade
175 Bottles of Beer To Trades away To Trades away 35 Bottles of Wine Trade Between Carl & Mike 1 Wine trades for 5 Beer or 1 Beer trades for 1/5 Wine Mike (specializes in wine) Carl (specializes in beer) Before trade Mike gave up 1 wine to get 1 beer, after trade1/5 wine Before trade Carl gave up 10 beer to get a wine, after trade 5 beer
Carl & Mike After Specialization & Trade Carl Trades For (+) Away (-) Consumes After Trade Produced & Consumed Before Trade Gains from Trade Produces Wine (btls.) Beer (btls.) 0 1,000 +35 -175 35 825 30 700 +5 +125 Mike Trades For (+) Away (-) Consumes After Trade Produced & Consumed Before Trade Gains from Trade Produces Wine (btls.) Beer (btls.) 80 0 -35 +175 45 175 40 40 +5 +135
Consumption after trade D • Mike’s Production Possibilities After Trade Bottles of beer 1000– 900– 825– 800– 700– 600– 500– 400– 300– 200– 175– 80– 40– Mike produces 80 wine and then trades 35 wine for 175 leaving him with 45 wine and 175 beer, point D • A B • C • | | | | | | | | | | | 0 10 20 30 40 45 50 60 70 80 90 100 Bottles of wine
• D Consumption after trade Carl’s Production Possibilities/ Opportunity Costs, After Trade Bottles of beer Carl produces 1000 beer and trades 175 beer to Mike for 35 wine, leaving him with 825 beer and 35 beer, point D • A 1000– 900– 825– 800– 700– 600– 500– 400– 300– 200– 100– B • C • | | | | | | | | | | | 10 20 30 35 40 50 60 70 80 90 100 0 Bottles of wine
Gains from Specialization • Specialization produces gains for both traders, even when one trader enjoys an absolute advantage in both endeavors. • Specialization • Uses differences in individual skills • Breaks tasks into simple steps which multiplies the productivity of workers by deepening skills via practice