Download
1 / 45
530 likes | 1.87k Vues
Case-control study 3 : Bias and confounding and analysis. Preben Aavitsland. Contents. Monday 1 Design: Case-control study as a smarter cohort study The odds ratio Tuesday 2 Choosing cases and controls Power calculation Wednesday Case-control studies in outbreaks Thursday 3

E N D
Case-control study 3:Bias and confoundingand analysis Preben Aavitsland
Contents • Monday 1 • Design: Case-control study as a smarter cohort study • The odds ratio • Tuesday 2 • Choosing cases and controls • Power calculation • Wednesday • Case-control studies in outbreaks • Thursday 3 • Bias and confounding • Matching • Analysis
Summary of the case-control study • Study causal effects of exposures (risk factors, preventive factors) on disease • Define cases • Find source population • Select controls that are representative of source population • Ask cases and controls the same questions about exposures • Compare exposure ratios between cases and controls, OR = a/b / c/d
Calculating the odds ratio (OR) • Cross product ratio: ad / bc = a/b / c/d
Can we believe the result? Having a dog TBE OR = RR = 4.5
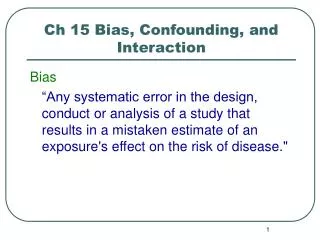
Random error Results in low precision of the epidemiological measure measure is not precise, but true 1 Imprecise measuring 2 Too small groups What can be wrong in the study? Systematic errors(= bias) Results in low validity of the epidemiological measure measure is not true 1 Selection bias 2 Information bias 3 Confounding
Errors in epidemiological studies Error Random error (chance) Systematic error (bias) Study size
Random error • Low precision because of • Imprecise measuring • Too small groups • Decreases with increasing group size • Can be quantified by confidence interval
Estimation • When we measure OR, we estimate a point estimate • Will never know the true value • Confidence interval indicates precision or amount of random error • Wide interval low precision • Narrow interval high precision • OR = 4.5 (2.0 – 10)
OR and confidence interval • Shows magnitude of the causal effect • Shows direction of the effect • OR > 1 increases risk (risk factor) • OR > 1 decreases risk (preventive factor) • Shows the precision around the point estimate • Condition: no systematic errors • Forget about p-values! No advantages.
Larger study narrower interval Use Episheet
Systematic error • Does not decrease with increasing sample size • Selection bias • Information bias • Confounding
Selection bias • Error because the associationexposure diseaseis different for participants and non-participants in the study • Errors in the • procedures to select participants • factors that influence participation
Examples of selection bias • Self-selection bias • Healthy worker effect • Non-response • Refusal • Loss to follow-up
Can we believe the result? Having a dog TBE OR = IRR = 4.5 OR=ad / bc Cases were interviewed in the hospital. Controls were interviewed by phone to their home in the evening. But then, many dog-owners would be walking their dog…
Preventing selection bias • Same selection criteria • High response-rate • High rate of follow-up
Information bias • Error because the measurement of exposure or diseaseis different between the comparison groups. • Errors in the • procedures to measure exposure • procedures to diagnose disease
Examples of information bias • Diagnostic bias • Recall bias • Researcher influence
Can we believe the result? Having a dog TBE OR = IRR = 4.5 OR=ad / bc Cases were so eager to find an explanation for their disease that they included their neighbours’ dog when they were asked whether they had a dog…
Misclassification True Differential Non-differential
Non-differential misclassification • Same degree of misclassification in both cases and controls • OR will be underestimated • True value is higher • If no causal effect found, ask: • Could it be due to non-differential misclassification?
Preventing information bias • Clear definitions • Good measuring methods • Blinding • Standardised procedures • Quality control
Confunding - 1 “Mixing of the effect of the exposure on disease with the effect of another factor that is associated with the exposure.” Eksposure Disease Confounder
Confounding - 2 • Key term in epidemiology • Most important explanation for associations • Always look for confounding factors Surgeon Post op inf. Op theatre I
Criteria for a confounder 1 A confounder must be a cause of the disease (or a marker for a cause) 2 A confounder must be associated with the exposure in the source population 3 A confounder must not be affected by the exposure or the disease Umbrella Less tub. 2 1 Class 3
Find confounders “Second, third and fourth child are more often affected by Downs’ syndrome.” Many children Downs’ Maternal age
Find confounders ”The Norwegian comedian Marve Fleksnes once stated: I am probably allergic to leather because every time I go to bed with my shoes on, I wake up with a headache the next morning.” Sleep shoes Headache Alcohol
Find confounders “A study has found that small hospitals have lower rates of nosocomial infections than the large university hospitals. The local politicians use this as an argument for the higher quality of local hospitals.” Small hosp Few infections Well patients
In the design Restriction of the study Matching In the analysis Restriction of the analysis Stratification Multivariable regression Controlling confounding
Restriction Restriction of the study or the analysis to a subgroup that is homogenous for the possible confounder. Always possible, but reduces the size of the study. Umbrella Less tub. Lower class Class
Restriction We study only mothers of a certain age Many children Downs’ 35 year old mothers
Matching “Selection of controls to be identical to the cases with respect to distribution of one or more potential confounders.” Many children Downs’ Maternal age
Disadvantages of matching • Breaks the rule: Control group should be representative of source population • Therefore: Special ”matched” analysis needed • More complicated analysis • Cannot study whether matched factor has a causal effect • More difficult to find controls
Why match? • Random sample from source population may not be possible • Quick and easy way to get controls • Matched on ”social factors”: Friend controls, family controls, neighbourhood controls • Matched on time: Density case-control studies • Can improve efficiency of study • Can control for confounding due to factors that are difficult to measure
Should we match? • Probably not, but may: • If there are many possible confounders that you need to stratify for in analysis
Stratified analysis • Calculate crude odds ratio with whole data set • Divide data set in strata for the potential confounding variable and analyse these separately • Calculate adjusted (ORmh) odds ratio • If adjusted OR differs (> 10-20%) from crude OR, then confounding is present and adjusted OR should be reported
Multivariable regression • Analyse the data in a statistical model that includes both the presumed cause and possible confounders • Measure the odds ratio OR for each of the exposures, independent from the others • Logistic regression is the most common model in epidemiology
In the design Restriction of the study Matching In the analysis Restriction of the analysis Stratification Multivariable methods Controlling confounding
Random error Results in low precision of the epidemiological measure measure is not precise, but true 1 Imprecise measuring 2 Too small groups What can be wrong in the study? Systematic errors(= bias) Results in low validity of the epidemiological measure measure is not true 1 Selection bias 2 Information bias 3 Confounding