Download
1 / 18
180 likes | 642 Vues
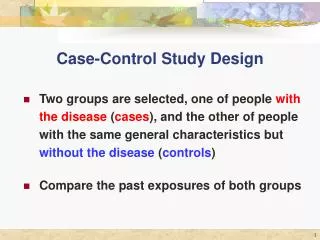
Design and Analysis of Clinical Study 7. Analysis of Case-control Study. Dr. Tuan V. Nguyen Garvan Institute of Medical Research Sydney, Australia. Overview. Risk Odds ratio (OR) Standard erros of OR 95% confidence interval of OR Interpretation. Results of a CC study. Population.

E N D
Design and Analysis of Clinical Study 7. Analysis of Case-control Study Dr. Tuan V. Nguyen Garvan Institute of Medical Research Sydney, Australia
Overview • Risk • Odds ratio (OR) • Standard erros of OR • 95% confidence interval of OR • Interpretation
Results of a CC study Population Cases Controls Risk+ Risk- Risk+ Risk- a b c d
Odds • Let p be a probability (p is between 0 and 1) • Odds is defined as: • Odds is the likelihood of the occurrence of an event to the non-occurrence of the event • Obviously, when p = 0.5, odds = 1.
Odds Ratio (OR) • Odds of risk factor presence to absence in cases: • Odds of risk factor presence to absence in controls: • Odds ratio:
Interpretation of OR • OR = 1: the risk of disease is the same for exposed (presence of the risk factor) and unexposed (absence of the risk factor) • OR > 1: the risk of disease higher in exposed than in unexposed. In other words, the risk factor increases the probability of getting disease. • OR < 1: the risk of disease lower in exposed than in unexposed.
Sampling Distribution of OR • OR is an estimate of a true OR (l) • Estimate is subject to sampling variation • Sampling variation is characterized by • Mean • Variance • OR is an unbiased mean of l. • Variance of OR ? • Can not be determined directly • Have to determined indirectly – log(OR)
Variance and 95% of OR • OR = (ad) / (bc) • L = log(OR) • var(L) = s2 = 1/a + 1/b + 1/c + 1/d • Standard error of L: s = sqrt(s2) • 95% confidene interval (CI) of L: L–1.96*s to L+1.96*s • 95% CI of OR: eL–1.96*s to eL–1.96*s
An Example: Prostate cancer and Agent Orange • Giri et al (2004) conducted a pilot case control study to examine the association between prostate cancer risk and Agent Orange exposure among American soldiers who served in Vietnam during the war time. The investigators identified 47 Vietnam era veterans with a diagnosis of prostate cancer. They further randomly selected 142 veterans who were hospitalized for a reason other than cancer from a hospital data base. In each group, the investigators assessed whether an individual was exposed to Agent Orange (AO) during the war. The results are as follows
An Example: Prostate Cancer and Agent Orange • OR = (11 x 106) / (17 x 29) = 2.37 • L = log(2.37) = 0.861 • var(L) = s2 = 1/11 + 1/17 + 1/29 + 1/106 = 0.1936 • s = sqrt(0.1936) = 0.44 • 95% confidene interval (CI) of L: = 0.861–1.96*0.44 to 0.861+1.96*0.44 = –0.00151 to 1.724 • 95% CI of OR = e-0.00151 to e1.724 = 1.00 to 5.63
Distribution of OR Distribution of OR = 2.37 with 95% confidence interval = 1.0 to 5.63
Matched Case-Control Study • Confounding is a potential problem of CC study • Matched CC study: cases and controls are matched for a confounding factor. • Step 1: Select a case • Step 2: Record the confounding factor • Step 3: Randomly select a control who has exactly the same confounding factor as the case • Repeat steps 1-3 until the sample size is adequate. • 2x2 Table
An Example: Hip fracure and Osteoporosis • A case control study was under taken to examine the association between osteoporosis and risk of hip fracture. 51 cases of hip fracture were identified, and were individually age-matched with 51 controls (who had no fracture). The results are shown in the following table (“0” is for “non-osteoporosis” and 1 is for “osteoporosis”). pair age Hip fx Control 1 61 0 0 2 62 1 0 3 64 0 0 4 64 1 0 5 64 1 1 ... 49 85 1 1 50 86 0 0 51 87 1 1
Analysis of Matched CC by the z-test • Summary of results • Proportion of hip fx who had osteoporosis: P1 = (11+28)/51 = 0.765 • Proportion of controls who had osteoporosis: P2 = (11+2)/51 = 0.255 • Difference: D = P1 – P2 = 0.765 – 0.255 = 0.51 • Variance of D: s2 = (28+2) / (51)2 = 0.0115 • Standard error of D: s = sqrt(0.0115) = 0.107 • z = 0.51 / 0.107 = 4.77 • Highly significant!
Analysis of Matched CC by OR • Summary of results • OR = 28/2 = 14 • L = Log(OR) = log(14) = 2.64 • Variance of L: s2 = 1/28 + 1/2 = 0.536 • Standard error of L: s = sqrt(0.536) = 0.732 • 95% CI of L: 2.64 ± 1.96*0.732 = 1.20 to 4.07 • 95% CI of OR: e1.20 = 2.33 to e4.07 = 58.8
Statistical Methods The relationship between [risk factor] and [outcome, disease] was assessed by the odds ratio (OR) for case-control study. In this analysis, the study’s result was summarized into a 2x2 table with two categories of risk factor and outcome. The exposure OR was then computed from the table. The statistical significance of OR was assessed by the 95% confidence interval (CI) of OR. A CI does not include unity was considered statistically signigicant at the 5% significance level.
Exercises • Preston-Martin et al (1989) conducted a case-control study to investigate the etiology of acoustic neuromas. Eighty-six men were diagnosed to have acoustic neuromas. The researchers selected another 86 men of the same race and within 5 years of age compared to the cases. • The researchers were interested in the effect of exposure to loud noise. They found 58 cases and 46 controls had had some exposure to loud noise at work. Carry out an appropriate analysis and interpret the result of analysis.
Exercises • R Doll and B Hill. BMJ 1950; ii:739-748