Download
1 / 15
200 likes | 1.15k Vues
Design and Analysis of Clinical Study 8. Cross-sectional Study. Dr. Tuan V. Nguyen Garvan Institute of Medical Research Sydney, Australia. Cross-sectional Study. Cross-sectional studies are studies of prevalence. Proportion with an attribute or disease / Number of subjects = Prevalence.

E N D
Design and Analysis of Clinical Study 8. Cross-sectional Study Dr. Tuan V. Nguyen Garvan Institute of Medical Research Sydney, Australia
Cross-sectional Study • Cross-sectional studies are studies of prevalence. Proportion with an attribute or disease / Number of subjects = Prevalence. • 3 important questions to consider: • Definition of Case • Definition of the Population • Are cases and non-cases from an unbiased sample of the population?
Preparing Cross-sectional Study • In Cross-sectional studies think of: • Sampling Procedures. • Clear definition of Target Population. • Clear definition of outcome. • Clear definition of risk factors. • Remember Confounders. • Remember seasonal variations.
Uses of Cross-sectional Study • Identify and describe a problem • Collect information for planning e.g. surveys of immunisation, antenatal care, coverage • Evaluate utilisation rates of services • Monitoring health status of a community by regular repeated surveys
Using Cross-sectional Studies for Hypotheses Formulation Method of Difference. If frequency of a disease is markedly different between two groups then it is likely to be caused by a particular factor that differs between them. Method of Agreement. If a factor commonly occurs in which a disease occurs with high frequency then the factor is very likely associated with the disease. Concomitant variation. Frequency of a factor varies in proportion to frequency of disease.
Surveys Surveys are a form of cross-sectional studies used for: • Assessing attitudes, opinions or beliefs • To study characteristics of populations regarding behaviour e.g. health service utilisation; drug use; smoking; alcohol consumption etc. • Information about socio-demographic characteristics
Modification of Cross-sectional Study I Trend Design Future Sampling Population Risk Factor Present Disease Prevalence Risk Factor Sampling Disease Prevalence
Modification of Cross-sectional Study II Panel Design Present Future Risk Factor Risk Factor Population Disease Prevalence Disease Prevalence Same Sample Sample
Sample Size General formula of sample size for 1 group: General formula of sample size for 2 groups: Constant C associated with Type I and Type II Errors
Sample Size for One Parameter • Case 1. We want to estimate the average height of Vietnamese men. • We accept an error of 1 cm (d = 1) • 95% confidence interval (or a=0.05) and power = 0.8 (b = 0.2). • Previous data suggest that the standard deviation of height was 4.6 cm. • The sample size is:
Sample Size for One Parameter • Case 2. We want to estimate the prevalence of smokers in the population. • We accept an error of 2% • Previous data suggest that the prevalence is around 70% • The minimal sample size is 2017:
Sample Size for Comparing Two Groups • In case-control study the data are usually summarized by an odds ratio (OR), rather then difference between two proportions. • If p1 and p2 are the proportions of cases and controls, respectively, exposed to a risk factor, then: • If we know the proportion of exposure in the general population (p), the total sample size N for estimating an OR is: • Where r = n1 / n2 is the ratio of sample sizes for group 1 and group2; p is the prevalence of exposure in the controls; and OR is the hypothetical odds ratio. If n1 = n2 (so that r = 1) then the fomula is reduced to:
Sample Size for Comparing Two Groups • Example: The prevalence of vertebral fracture in a population is 25%. It is interested to estimate the effect of smoking on the fracture, with an odds ratio of 2, at the significance level of 5% (one-sided test) and power of 80%. • The total sample size for the study can be estimated by:
Advantages Useful for descriptive studies Rapid, inexpensive, can provide analytic clues. Less prone to error about exposure recall and bias Advantages and Disadvantages of Cross- sectional Studies Disadvantages • Unable to sort out what came first exposure or outcome • Prone to sample distortion bias.
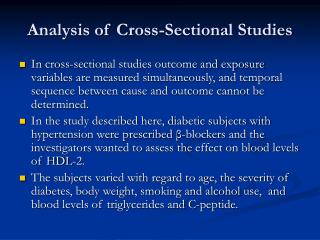
Analysis of Cross-sectional Studies • Descriptive analyses • Analysis of differences • Analysis of association / relationship • Multivariable analysis