Download
1 / 67
820 likes | 1.35k Vues
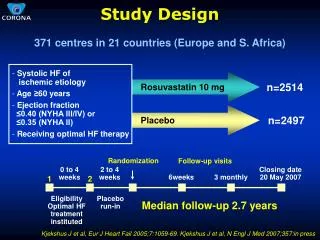
Guangzhou October 9, 2010. Clinical Study Design. Henrik Ekberg, MD, PhD Malmö, Sweden Associate Editor: American Journal of Transplantation 2003- Editorial Board Member: Transplantation 2004 - Transplant International 2004 - Clinical Transplantation 2008 -

E N D
Guangzhou October 9, 2010 Clinical Study Design Henrik Ekberg, MD, PhD Malmö, Sweden Associate Editor: American Journal of Transplantation 2003- Editorial Board Member: Transplantation 2004 - Transplant International 2004 - Clinical Transplantation 2008 - Journal of Transplantation 2008 -
Rejection of submitted manuscript- various reasons • Rejected on priority grounds: Maybe a good study • but not a topic of interest, or done before • Rejected, not allowed resubmission: • a bad study; design problems, cannot be re-written in a good way • Rejected but allowed resubmission: • no serious design problems, interesting topic, but needs to be rewritten for language, discussion, figures, tables, etc.
Rejection of submitted manuscript- various reasons • Rejected on priority grounds: Maybe a good study • but not a topic of interest, or done before • Rejected, not allowed resubmission: • a bad study; design problems, cannot be re-written in a good way • Rejected but allowed resubmission: • no serious design problems, interesting topic, but needs to be rewritten for language, discussion, figures, tables, etc.
Study design alternatives • Retrospective studies • = Using medical charts of existing data • Uncontrolled • Case-controlled • Hypothesis generating • Prospective studies • = Protocol directives for Rx and F/u • Uncontrolled, one-arm, pilot • Randomized Controlled Trial (RCT) • Hypothesis testing
Clinical study design phases • Phase 1 • Drug action, metabolism, PK, PD, safety • Phase 2 • Limited (un)controlled study for efficacy and safety • Phase 3 • Large randomized multicenter study • Determine efficacy and safety for FDA and EMEA • Phase 4 • After drug release: new uses of the drug • Marketing
Key Elements of Trial Quality • Hypothesis • Appropriate population • Clinically relevant achievement • Adequately-powered • End points • Comparison group(placebo) • Randomized • Double-blind • Intent-to-treat analysis • Protocol • Analysis plan
Key Elements of Trial Quality Experimental Hypothesis May be based on a pilot or retrospective study or on hopes for a new drug Drug A > drug B (or placebo) with regards to … Null hypothesis (H0): A < B, A > B (no difference) A < B (non-inferiority)
Key Elements of Trial Quality Appropriate population Include: Normal risk kidney transplant recipients from living or deceased donors Exclude: High risk patients, such as PRA > 20% (50%?) Retransplants (all?) High donor age ? Expanded donor criteria? Cold ischemia time ? HLA- DR mismatch ?
Key Elements of Trial Quality • Hypothesis • Appropriate population • Clinically relevant achievement • Adequately-powered • End points • Comparison group(placebo) • Randomized • Double-blind • Intent-to-treat analysis • Protocol • Analysis plan
The Success With one-year graft survival > 90% and acute rejection rates < 20%
The Problem With one-year graft survival > 90% and acute rejection rates < 20% we have a high level of success and further improvement is difficult to achieve and demonstrate we need very large studies!
End Points and Sample Size Primary end point The parameter on which 1. the hypothesis is based, to be verified or rejected 2. the sample size is calculated Secondary end points Additional parameters which may 1. describe the patients, events and results 2. be used for formulations of new hypotheses
End Points and Sample Size 1. Select the primary end point 2. Clinically relevant achievement regarding end point = Difference between control and experimental groups e.g.: GFR increased by 10 ml/min AR rate reduced by 10% 3. Determine the number of patients in each group needed to verify that the difference between the groups most likely is true (<5% risk of mistake). 4. With a certain power and p-value.
End Points and Sample Size “We chose to study 313 patients in each group in order to have 80% power of detecting a 33% reduction in AR rate from a baseline rate of 30% with a significance level of 0.05”. End point: Acute Rejection Clinically relevant achievement: 33% reduction (from 30% to 20%) Power: 80% Significance level: 5% Therefore: Number of patients in each group: 313
End Points and Sample Size “We chose to study 313 patients in each group in order to have 80% power of detecting a 33% reduction in AR rate from a baseline rate of 30% with a significance level of 0.05”. • = p-value = 0.05; means a 5% risk of obtaining a group difference by chance (although there is no true difference). = 0.20 means a Power of 80%; that is 80% chance of obtaining a group difference and 20% risk of missing it (when there is a true difference). P1 = 0.30 and ∆ = 0.10 (33% of p1)
End Points and Sample Size • Question: • If there is a true difference between the groups and we do 100 studies with 313 patients in each group • How many studies will result in a group difference, that is at least a 33% reduction of AR? • 5 studies • 20 studies • 80 studies • 95 studies “We chose to study 313 patients in each group in order to have 80% power of detecting a 33% reduction in AR rate from a baseline rate of 30% with a significance level of 0.05”. • = p-value = 0.05; means a 5% risk of obtaining a group difference by chance (although there is no true difference). = 0.20 means a Power of 80%; that is 80% chance of obtaining a group difference and 20% risk of missing it (when there is a true difference). P1 = 0.30 and ∆ = 0.10 (33% of p1)
End Points and Sample Size • Question: • If there is a true difference between the groups and we do 100 studies with 313 patients in each group • How many studies will result in a group difference, that is at least a 33% reduction of AR? • 5 studies • 20 studies • 80 studies • 95 studies “We chose to study 313 patients in each group in order to have 80% power of detecting a 33% reduction in AR rate from a baseline rate of 30% with a significance level of 0.05”. • = p-value = 0.05; means a 5% risk of obtaining a group difference by chance (although there is no true difference). = 0.20 means a Power of 80%; that is 80% chance of obtaining a group difference and 20% risk of missing it (when there is a true difference). P1 = 0.30 and ∆ = 0.10 (33% of p1)
End Points and Sample Size 80 studies will show a significant difference and 20 studies will not. Comment: 20% risk of not seeing a true difference is quite high “We chose to study 313 patients in each group in order to have 80% power of detecting a 33% reduction in AR rate from a baseline rate of 30% with a significance level of 0.05”. • = p-value = 0.05; means a 5% risk of obtaining a group difference by chance (although there is no true difference). = 0.20 means a Power of 80%; that is 80% chance of obtaining a group difference and 20% risk of missing it (when there is a true difference). P1 = 0.30 and ∆ = 0.10 (33% of p1)
Question: If there is not a true difference between the groups and we do 100 studies with 313 patients in each group. How many studies will result in a group difference? 1. 5 studies 2. 20 studies 3. 80 studies 4. 95 studies End Points and Sample Size “We chose to study 313 patients in each group in order to have 80% power of detecting a 33% reduction in AR rate from a baseline rate of 30% with a significance level of 0.05”. • = p-value = 0.05; means a 5% risk of obtaining a group difference by chance (although there is no true difference). = 0.20 means a Power of 80%; that is 80% chance of obtaining a group difference and 20% risk of missing it (when there is a true difference). P1 = 0.30 and ∆ = 0.10 (33% of p1)
Question: If there is not a true difference between the groups and we do 100 studies with 313 patients in each group. How many studies will result in a group difference? 1. 5 studies 2. 20 studies 3. 80 studies 4. 95 studies End Points and Sample Size “We chose to study 313 patients in each group in order to have 80% power of detecting a 33% reduction in AR rate from a baseline rate of 30% with a significance level of 0.05”. • = p-value = 0.05; means a 5% risk of obtaining a group difference by chance (although there is no true difference). = 0.20 means a Power of 80%; that is 80% chance of obtaining a group difference and 20% risk of missing it (when there is a true difference). P1 = 0.30 and ∆ = 0.10 (33% of p1)
Question: If there is not a true difference between the groups and we do 100 studies with 313 patients in each group. How many studies will result in a group difference? 5 studies will show a group difference although this is not true End Points and Sample Size “We chose to study 313 patients in each group in order to have 80% power of detecting a 33% reduction in AR rate from a baseline rate of 30% with a significance level of 0.05”. • = p-value = 0.05; means a 5% risk of obtaining a group difference by chance (although there is no true difference). = 0.20 means a Power of 80%; that is 80% chance of obtaining a group difference and 20% risk of missing it (when there is a true difference). P1 = 0.30 and ∆ = 0.10 (33% of p1)
End Points and Sample Size “We chose to study 313 patients in each group in order to have 80% power of detecting a 33% reduction in AR rate from a baseline rate of 30% with a significance level of 0.05”. P-value = 5%; The risk of seeing a difference which is not true Power = 80%; The chance of seeing a difference which is true P1 = 0.30 and ∆ = 0.10 (33% of p1)
Sample Size for Acute Rejection p=0.05 We need to do large multicenter studies !!!
End Points and Sample Size Question: The primary end point (PEP) and 10 secondary end points (SEP) were analysed; SEP in two ways each. The PEP was NS, one of the SEP was stat sign (P<0.05). Why is the analysis more reliable for PEP than SEP? Is this significant result of the SEP reliable? 10 x 2 = 20 tests What is the probability of a “significant finding” by chance?
The trap of multiple tests Use p = 0.05 / no. of tests
Key Elements of Trial Quality • Hypothesis • Appropriate population • Clinically relevant achievement • Adequately-powered • End points • Comparison group(placebo) • Randomized • Double-blind • Intent-to-treat analysis • Protocol • Analysis plan
Clinical End Points We want to achieve improvement in patient survival and graft survival These are the Clinical end points
Uncontrolled Trial: Patient Survival (n=5) Five cadaver kidney transplant recipients received azathioprine One patient survived 365 days, becoming the first successful cadaveric transplant Murray, et al. New Engl J Med 1963; 268:1315
RCT: Graft & Patient Survival (n=232) 1-year graft survival • CsA.......72% • Aza........52% 1-year patient survival • CsA.......94% • Aza........92% p=0.001 NS European Multicentre Trial Group. Lancet 1983; 2:986
Where Did We Go From Here? Acute rejection is associated with graft survival Acute rejection became the surrogate end point for graft survival
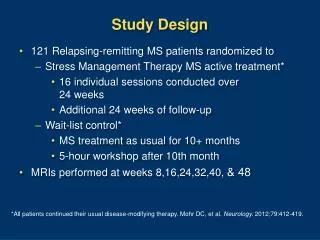
RCT: Acute Rejection (n=1493) • Acute rejection at 6 mo. • MMF 2g...........20% • MMF 3g...........17% • Pla/Aza.............41% • 1-year graft survival • MMF 2g...........90% • MMF 3g...........89% • Pla/Aza............88% p<0.01 NS Halloran, et al. Transplantation 1996; 63:39
Where Did We Go From Here? Conclusion of MMF trials: “Acute rejection was reduced but graft survival was not improved” Was this true - or a question of insufficient power of the study? What difference in graft survival should have been expected?
Sample size and power to verify true differences in graft survival of 4% or 5%. Ekberg H. Transpl Rev 2003; 17: 187
Surrogate Endpoint Definitions Clinical endpoint: A characteristic or variable that reflects how a patient feels, functions or survives. Surrogate endpoint: A biomarker that is intended to substitute for a clinical endpoint, and predict clinical benefit … Biomarkers Definitions Working Group. Clin Pharmacol Ther 2001; 69:89
Risk factors and potential End points Risk factors after transplantation Acute rejection Graft function New onset of diabetes mellitus Cholesterol levels Treatment failure (drug toxicity) Malignancy Do they predict graft or patient survival?
Possible Surrogate Endpoints • Acute rejection • Acute rejection + 1/Cr return to baseline • 1-year graft function • Composite end point • Association or Prediciton ?
AR-1/SCr within 5% from baseline No acute rejection 73.4% 73.1% AR-1/SCr worse than 5% from baseline 49.4% n = 55,092 n = 4,061 n = 2,782 n = 22,212 n = 2,669 n = 1,455 n = 2,891 n = 414 n = 221 Acute Rejection with 1/Cr return to baselineTransplants 1995–2002 1.0 0.9 0.8 Graft Survival (%) 0.7 0.6 0.5 0.4 0 6 12 18 24 30 36 42 48 54 60 66 72 Time Posttransplantation (mo) Log-rank P value for equality of strata ≤0.0001.Meier-Kriesche et al. ATC 2003.
Predictive Quality for Graft Loss: AR vs. AR Without Return to Baseline Acute Rejection No Return to Baseline Acute Rejection Follow-up Positive Predictive Value 2 years 9.2 15.8 6 years 27.6 38.5 Conclusion: AR and AR with return to baseline are associated but not predictive of graft survival Meier-Kriesche et al. ATC 2003.
“Post-transplant Renal Function at 1 Year Predicts Long-Term Kidney Transplant Survival” N = 61,157 100 80 60 Graft Survival(%) <1.0 1.0 - 1.5 40 1.6 - 2.0 2.1 - 2.5 20 2.6 - 3.0 >3 0 0 12 24 36 48 60 Months Posttransplantation Hariharan S et al. Kidney Int. 2002; 62: 311.
1.0 1.0 1.1 1.2 0.9 1.3 1.4 0.8 1.5 0.7 1.6 1.7 0.6 1.8 0.5 1.9 2.0 0.4 2.1 2.3 0.3 2.5 0.2 3.0 0.1 0.0 0.1 0.2 0.3 0.4 0.5 0.6 0.7 0.9 1.0 0.8 ROC Plot for 7-Year Overall Graft Loss From 1-Year Creatinine Baseline Level AUC = 0.624 Sensitivity 0.0 1 - Specificity ROC = receiver operator curve. H-U Meier-Kriesche
1.0 1.0 1.1 1.2 0.9 1.3 1.4 0.8 1.5 0.7 1.6 1.7 0.6 1.8 0.5 1.9 2.0 0.4 2.1 2.3 0.3 2.5 0.2 3.0 0.1 0.0 0.1 0.2 0.3 0.4 0.5 0.6 0.7 0.9 1.0 0.8 ROC Plot for 7-Year Overall Graft Loss From 1-Year Creatinine Baseline Level AUC = 0.624 Sensitivity 0.0 1 - Specificity ROC = receiver operator curve. H-U Meier-Kriesche
Prediction Diagnostics for Seven Year Overall Graft Loss from One Year Creatinine Level H-U Meier-Kriesche
Possible Surrogate Endpoints Acute rejection Acute rejection + 1/Cr return to baseline 1-year graft function Composite end point
Composite end point (CEP) 1,389 KTx at Univ of Minnesota 1985-1997 Creat at 1 year (Cr12) Cr12 <1.0 to >3.0 -> 10 yr GS from 75% to 25% Suggested Composite End Point: Graft loss < 12 mo. or Cr12 > 2.0 Reduction of CEP incidence by 33% 626 patients in total needed in such study Paraskevas et al Transplantation 2003; 75: 1256
Composite end point (CEP) CEP definition: Occurrence of at least one Acute rejection, Graft loss, Death or S-Creat > 1.5 UNOS data base 1995-2000: 59,000 patients 61.2% met the CEP • Margin for improvement • Less number of patients needed Siddiqi et al ATC 2003; #1160 Hariharan et al AJT 2003; 3: 933
Composite end point (CEP) CEP: Not a surrogate end point – no prediction Not a clinical end point – incl ‘surrogate’ factors Weighted score: Death 1.0 x proportion Graft loss 0.5 x proportion Acute rej 0.25 x proportion S-crea>1.5 0.25 x proportion Hariharan et al AJT 2003; 3: 933
Clinical end point (short term only) Alternatively; Clinical end point (“how the patient functions …”) without prediction of long-term patient or graft survival e.g. GFR (Cockcroft-Gault formula) at 12 mo. Symphony study e.g. New Onset of Diabetes After Transplantation (NODAT) according to American Diabetes Association (ADA) definitions