Download
1 / 19
190 likes | 202 Vues
Explore the correlation between fractal properties of resource data and system workload, develop a fractal-based model for resource exhaustion, and use it for predictive maintenance planning.

E N D
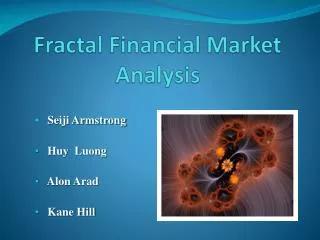
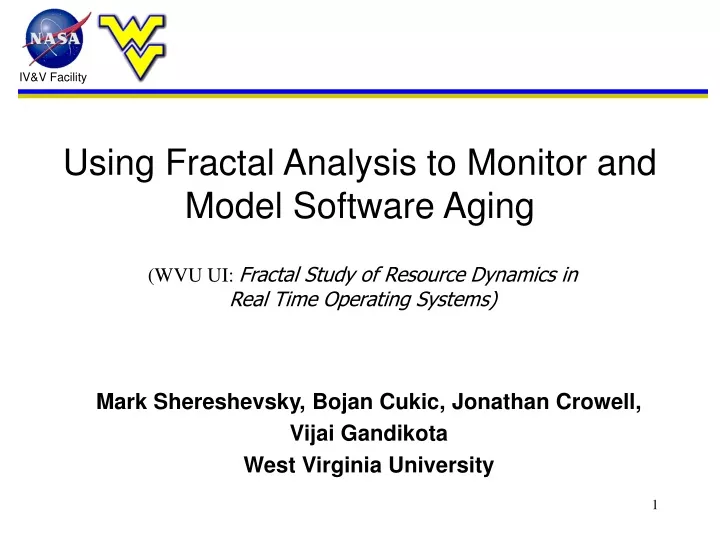
Using Fractal Analysis to Monitor and Model Software Aging (WVU UI: Fractal Study of Resource Dynamics in Real Time Operating Systems) Mark Shereshevsky, Bojan Cukic, Jonathan Crowell, Vijai Gandikota West Virginia University
Overview • Introduction and motivation • Fractality of resource utilization measures in operating systems • Modeling software aging • Experimental results • Summary
Introduction • “Software aging" phenomenon implies that the state of the software system degrades with time. • The degradation manifests itself in performance decline (excessive paging and swapping activity etc.), possibly leading to crash/hang failures or both. • Degradation is caused, in particular, by the exhaustion of the operating system resources, such as the number of unused memory pages, the number of disk blocks available for page swapping, etc.
Earlier Studies of Resource Exhaustion • Vaidyanathan and Trivedi describe the behavior of operating system recourses as a function of time. • Slope (trend) depends on the workload state of the system. • Workload dynamics is modeled as semi-Markov process. • In many workload states the dynamics of the resources demonstrates very high variance resulting in very broad confidence intervals. • The highly irregular and oscillatory behavior of the data makes most trend model insufficient.
Our Research Objectives • Investigate correlation between fractal properties of the resource data and the system’s workload. • Develop fractal-based model of the resource exhaustion process. • Apply it to real-time operating systems. • Investigate possibility of using such model for predicting system outages and for preventive maintenance planning.
Goal of the Study • Can resource exhaustion be predicted? • Interested in monitoring approaches, suitable for NASA deep space probes. • Can fractal theory help? • Does system usage dynamics display fractal behavior over time? • Analyze patterns of fractality in OS resources and establish connection with the resource exhaustion.
Initial Data Collection: Memory Resources • sml_mem - mem reserved for small requests • lg_mem - mem reserved for large requests • sml_alloc - mem allocated for small requests • lg_alloc - mem allocated for large requests • freemem - pages of free memory • freeswap - swap space on disk • First data collected from a department’s sun server, Sept. 15 - Sept 22, 2001
Fractality of Memory Resources • Can this be used to predict a system crash ?
HÖlder Exponent of a Function • HE characterizes the degree of local “burstiness” (fractality) of the function. • The lower (closer to 0) the HE, the “wilder” the local oscillations. • For a smooth function HE = 1 (or higher).
Plots of Data With Hölder Exponent realMemoryFree data from SUN server (high workload); Hölder exponents for the data sets.
Hölder Exponent Hystogram: An Example The histogram of Hölder exponent for realMemoryFree (high workload).
Recent Data Collection • Windows 2000 system stress tool used. • 2 computers networked together, • One barraged the other with workload. • The stress load was increased until a crash occurred.
Selecting Parameters for Monitoring • Over a hundred OS parameters monitored. • We selected the three which: • Do not have smooth or locally constant behavior; • Do not represent “per-unit-of-time” quantity (such as system_calls_per_sec ); • Do not have very high (over 0.9) mutual correlations. • Selected parameters (resources): • Available_bytes; • Pool_paged-allocs; • System_cache_resident_bytes. • We combine the parameters into a 3-dimensional “resource vector” and monitor its fractal dynamics.
Recent Experiments: Some Plots Available Bytes, Pool Paged Allocs, Sys Cache Resident Bytes, and Multi-dimensional Hölder exponent
Observations and Hypotheses • As the stress increases, HÖlder exponent decreases (fractality increases). • The decrease of HÖlder exponent may be viewed as quantitative measure of resource exhaustion. • Fractality tends to change in jumps. • Most of our experiments show two noticeable drops in HÖlder exponent before crash occurs.
Can Crashes Be Anticipated? • Conjecture: the second “fractal jump” observed during the system’s operation signals a dangerous level of resource exhaustion which may lead to crash. However, there is still enough time for graceful shutdown of system. • Problems: • Detection of “jumps” in noisy HE signal. • What is optimal shutdown time strategy (shut it down immediately? Let the system run? For how long?).
Automatic Detection of “Fractal Jumps” The HE plots with pink lines indicating “fractal jumps”.
Summary • Is the “theory of the 2nd fractal jump” viable? • How long does the system have to live after the 2nd jump? • Develop a strategy for automatic preventive shut-down of the system based on the “fractal jumps” detection. • Collect more and “better” data. • Allow load increases and decreases. • Explore the possibility to incorporate other parameters into the analysis framework. • Port the analysis into a real-time environment. • NASA simulated testbeds, ARTS II processor (ISR).