Download

1 / 28
280 likes | 410 Vues
Just In Time Carbon Footprint. Manu Gupta, Stephen Intille and Kent Larson MIT Media Lab, House_n. manug@mit.edu intille@mit.edu kll@mit.edu. Carbon Footprint. Measurement & calculation of CO 2 emitted as part of daily life activities Why measure Conserve energy

E N D
Just In TimeCarbon Footprint Manu Gupta, Stephen Intille and Kent Larson MIT Media Lab, House_n manug@mit.edu intille@mit.edu kll@mit.edu
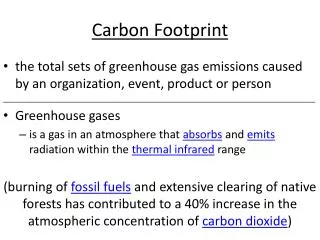
Carbon Footprint • Measurement & calculation of CO2 emitted as part of daily life activities • Why measure • Conserve energy • Allow people to be aware of their emission • Help people change usage patterns • Its our responsibility
Our Focus • Behavior change Measuring and motivating energy conservation behavior at the personal level
PlaceLab- A Live-In Laboratory • Data Collection • Only electric current information • 37 different electrical circuits fitted with current sensors • Circuits are divided into residential spaces and residential appliances
PlaceLab- A Live-In Laboratory • Data Analysis • A Couple lived in the PlaceLab for 10 weeks • One day analysis • Annotation • Video analysis of usage, movement and behavior patterns • Current analysis • Of each individual appliance/device’s energy consumption
Analysis Tool • Handlense sensor visualization tool • Developed at House_n Vampire power sources Unused lights & Devices
Projected Usage Space in use Devices in use
Results • Total electricity consumed in 1 day = 13.45 KWh • With an “optimal” change in behavior (but without impacting quality of life) • They would have saved ~ 38% (5KWh) of the total electricity consumed
Behavior Change Strategies • To motivate energy conservation behavior two strategies can be used • Responsive Automation* • Just in Time Intervention* • *Current research is on designing these strategies and testing how • much energy can be saved using them.
Behavioral Change Interfaces • Exploring the use of phones for just-in-time positive reinforcement. • Key idea: positive reinforcement tied to small behavior changes (Detected by sensing) • May lead to gradual behavior change.
System Components • Sensor Network • Control and Actuation system • Mobile Devices • Intervention strategies
System Characteristics • Low power • Wireless • Affordable • Real Time interaction with mobile devices • Non intrusive • Right mix of automation and intervention