Download
1 / 62
620 likes | 883 Vues
Proteomics Informatics David Fenyő. David@FenyoLab.org. Course Information. http://fenyolab.org/pi2019. Protein Identification and Quantitation. Samples. Peptides. Mass Spectrometry. Quantity. intensity. m/z. Identity. Central Dogma of Molecular Biology. Transcription. Replication.

E N D
Proteomics InformaticsDavid Fenyő David@FenyoLab.org
Course Information http://fenyolab.org/pi2019
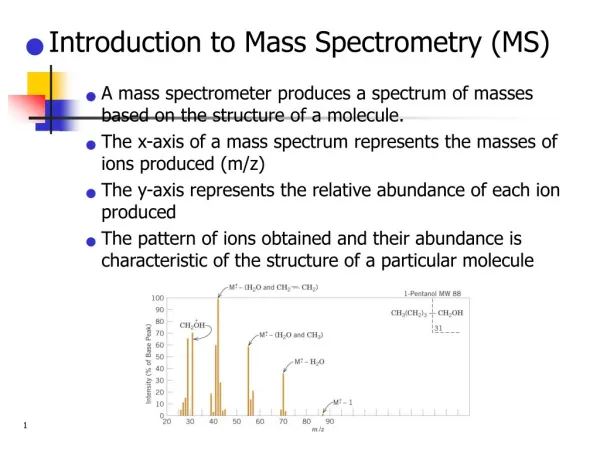
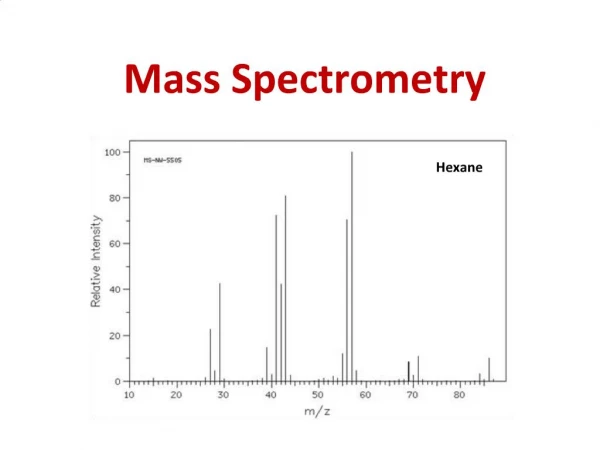
Protein Identification and Quantitation Samples Peptides Mass Spectrometry Quantity intensity m/z Identity
Central Dogma of Molecular Biology Transcription Replication Translation Modification P
Central Dogma of Molecular Biology Transcription Replication Translation Modification Functional Gene Products P
Central Dogma of Molecular Biology Transcription Replication Easy to measure Translation Modification P Difficult to measure
Central Dogma of Molecular Biology Transcription Replication Slow Translation Fast Modification P
Central Dogma of Molecular Biology Transcription Replication Degradation Translation X Degradation Modification P X
Central Dogma of Molecular Biology ERBB2 Breast Cancer RNA Transcription DNA Translation Modification P
Central Dogma of Molecular Biology ERBB2 Breast Cancer RNA Transcription DNA Translation Modification P
Central Dogma of Molecular Biology ERBB2 Breast Cancer RNA Transcription DNA Translation Modification P
Central Dogma of Molecular Biology ERBB2 Breast Cancer RNA RNA Transcription DNA DNA Ovarian Cancer Translation Modification P
Central Dogma of Molecular Biology KRT5 Breast Cancer Ovarian Cancer Colon Cancer Transcription Translation Modification P
Correlations between copy number, transcript, protein and phosphoprotein quantities ~ ~ ~ Copy Number / Transcript Transcript / Protein Protein / Phosphoprotein 1.0 0.8 0.5 0.5 Correlation 0.2 0.0 -0.5
Correlations between different genes Breast Cancer GRB7 Transcription ERBB2 GRB7 Translation ERBB2 Modification GRB7 P ERBB2
Correlations between different genes Breast Cancer GRB7 ERBB4 Transcription ERBB2 ERBB2 GRB7 ERBB4 Translation ERBB2 ERBB2 Modification GRB7 ERBB4 P ERBB2 ERBB2
Protein-Protein Correlations: Both Positive and Negative Breast Cancer
Motivating Example: Protein Complexes Alber et al., Nature 2007
Motivating Example: Signaling Choudhary & Mann, Nature Reviews Molecular Cell Biology 2010
Mass Spectrometry Based Proteomics Lysis Fractionation Digestion Mass spectrometry Peak Finding Charge determination De-isotoping Integrating Peaks Searching MS Identified and Quantified Proteins
Mass Spectrometry Ion Source Mass Analyzer Detector intensity mass/charge
Mass Spectrometry Ion Source Mass Analyzer 1 Frag-mentation Mass Analyzer 2 Detector y b
Example data – ESI-LC-MS/MS 762 100 875 [M+2H]2+ % Relative Abundance 633 292 405 534 1022 260 389 504 907 1020 663 778 1080 0 250 500 750 1000 m/z m/z MS/MS Time
Information Content in a Single Mass Measurement Human 10 8 6 Avg. #of matching peptides 4 3 2 1 1 2 3 4 6 8 10 #of matching peptides 1000 2000 3000 Tryptic peptide mass [Da] S. cerevisiae 10 8 6 Avg. #of matching peptides 4 3 2 1 1 2 3 4 6 8 10 #of matching peptides 1000 2000 3000 Tryptic peptide mass [Da]
Protein Identification by Mass Spectrometry Samples Peptides MS/MS Protein DB Compare, score, test significance Identified peptides and proteins
Tandem MS – Database Search Sequence DB Lysis Fractionation Pick Protein Digestion LC-MS Pick Peptide Repeat for all proteins MS/MS All Fragment Masses Repeat for all peptides MS/MS Compare, Score, Test Significance
Search Results Most proteins show very reproducible peptide patterns
Spectrum Library Search Spectrum Library Lysis Fractionation Digestion LC-MS/MS Pick Spectrum Repeat for all spectra MS/MS Compare, Score, Test Significance Identified Proteins
Interpretation of Mass Spectra S G F L E E D E L K 100 % Relative Abundance 0 250 500 750 1000 m/z
Interpretation of Mass Spectra 88 145 292 405 534 663 778 907 1020 1166 b ions S S G G F F L L E E E E D D E E L L K K 100 % Relative Abundance 0 250 500 750 1000 m/z
Interpretation of Mass Spectra 88 145 292 405 534 663 778 907 1020 1166 b ions S S G G F F L L E E E E D D E E L L K K 1166 1080 1022 875 762 633 504 389 260 147 y ions 100 % Relative Abundance 0 250 500 750 1000 m/z
Interpretation of Mass Spectra 88 145 292 405 534 663 778 907 1020 1166 b ions S S G G F F L L E E E E D D E E L L K K 1166 1080 1022 875 762 633 504 389 260 147 y ions 762 100 875 [M+2H]2+ % Relative Abundance 633 292 405 534 1022 260 389 504 907 1020 663 778 1080 0 250 500 750 1000 m/z
Interpretation of Mass Spectra 88 145 292 405 534 663 778 907 1020 1166 b ions S S G G F F L L E E E E D D E E L L K K 1166 1080 1022 875 762 633 504 389 260 147 y ions 762 100 875 [M+2H]2+ % Relative Abundance 633 292 405 534 1022 260 389 504 907 1020 663 778 1080 0 250 500 750 1000 m/z
Interpretation of Mass Spectra 88 145 292 405 534 663 778 907 1020 1166 b ions S S G G F F L L E E E E D D E E L L K K 1166 1080 1022 875 762 633 504 389 260 147 y ions 762 100 875 113 [M+2H]2+ 113 % Relative Abundance 633 292 405 534 1022 260 389 504 907 1020 663 778 1080 0 250 500 750 1000 m/z
Interpretation of Mass Spectra 88 145 292 405 534 663 778 907 1020 1166 b ions S S G G F F L L E E E E D D E E L L K K 1166 1080 1022 875 762 633 504 389 260 147 y ions 762 100 129 875 [M+2H]2+ % Relative Abundance 129 633 292 405 534 1022 260 389 504 907 1020 663 778 1080 0 250 500 750 1000 m/z
Interpretation of Mass Spectra 88 145 292 405 534 663 778 907 1020 1166 b ions S S G G F F L L E E E E D D E E L L K K 1166 1080 1022 875 762 633 504 389 260 147 y ions 762 100 875 [M+2H]2+ % Relative Abundance 633 292 405 534 1022 260 389 504 907 1020 663 778 1080 0 250 500 750 1000 m/z
Interpretation of Mass Spectra 88 145 292 405 534 663 778 907 1020 1166 b ions S S G G F F L L E E E E D D E E L L K K 1166 1080 1022 875 762 633 504 389 260 147 y ions 762 100 875 [M+2H]2+ % Relative Abundance 633 292 405 534 1022 260 389 504 907 1020 663 778 1080 0 250 500 750 1000 m/z
Interpretation of Mass Spectra 88 145 292 405 534 663 778 907 1020 1166 b ions S S G G F F L L E E E E D D E E L L K K 1166 1080 1022 875 762 633 504 389 260 147 y ions 762 100 875 [M+2H]2+ % Relative Abundance 633 292 405 534 1022 260 389 504 907 1020 663 778 1080 0 250 500 750 1000 m/z
De Novo Sequencing Amino acid masses 762 100 875 [M+2H]2+ % Relative Abundance 633 292 405 534 1022 260 389 504 907 1020 663 778 1080 0 250 500 750 1000 m/z Mass Differences Sequences consistent with spectrum
Significance Testing False protein identification is caused by random matching An objective criterion for testing the significance of protein identification results is necessary. The significance of protein identifications can be tested once the distribution of scores for false results is known.
Protein Quantitation by Mass Spectrometry Sample i C ij Protein j Lysis Peptide k Fractionation Digestion MS I LC - MS ik
Protein Quantitation by Mass Spectrometry Light Heavy Lysis Assumption: All losses after mixing are identical for the heavy and light isotopes and Fractionation Digestion Sample i Protein j Peptide k LC-MS MS H L Oda et al. PNAS 96 (1999) 6591 Ong et al. MCP 1 (2002) 376
Protein Quantitation LC-MS Targeted MS Shotgun proteomics 1. Records M/Z 1. Select precursor ion Digestion MS Fractionation 2. Selects peptides based on abundance and fragments 2. Precursor fragmentation Lysis MS/MS MS/MS 3. Use Precursor-Fragment pairs for identification 3. Protein database search for peptide identification MS Uses predefined set of peptides Data Dependent Acquisition (DDA)
Protein Identification by Mass Spectrometry Samples Peptides MS/MS Protein DB Compare, score, test significance Identified peptides and proteins