1 / 2

Below is the graph of a car's velocity with respect to time once the brakes are applied.

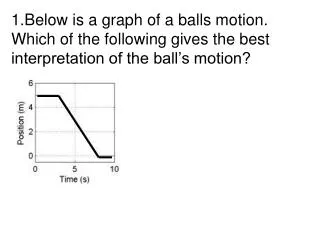
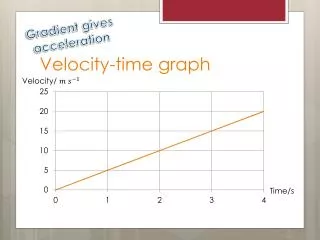
Below is the graph of a car's velocity with respect to time once the brakes are applied. (a)    If we call the abo ve curve g(t) , create accumulation function f(x) which represents the distance

barto
Télécharger la présentation

Below is the graph of a car's velocity with respect to time once the brakes are applied.

An Image/Link below is provided (as is) to download presentation Download Policy: Content on the Website is provided to you AS IS for your information and personal use and may not be sold / licensed / shared on other websites without getting consent from its author. Content is provided to you AS IS for your information and personal use only. Download presentation by click this link. While downloading, if for some reason you are not able to download a presentation, the publisher may have deleted the file from their server. During download, if you can't get a presentation, the file might be deleted by the publisher.

E N D

Presentation Transcript


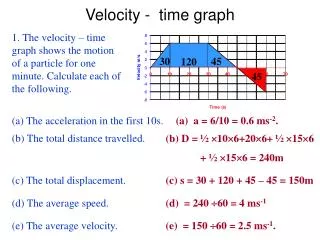
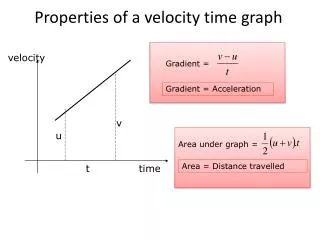
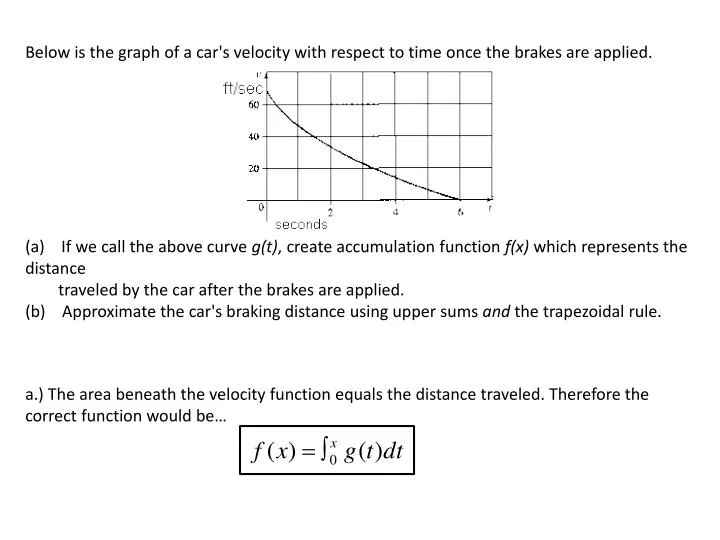
  1. Below is the graph of a car's velocity with respect to time once the brakes are applied. • (a)    If we call the above curve g(t), create accumulation function f(x) which represents the distance • traveled by the car after the brakes are applied. (b)    Approximate the car's braking distance using upper sums and the trapezoidal rule. a.) The area beneath the velocity function equals the distance traveled. Therefore the correct function would be…

  2. b.) Upper Sum: In order to do an upper sum, we must use a left riemann sum. N=6; Trap Sum: n=6;

More Related