Download
1 / 19
190 likes | 277 Vues
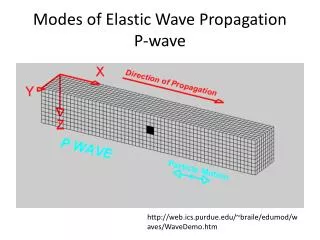
Discrimination of P-Wave Interval in Time-Quefrency Analysis for Proximity Microseismic Doublets. Koji Nagano Muroran Institute of Technology Muroran, Hokkaido, 050-8585, Japan nagano@mmm.muroran-it.ac.jp. What we want to know. Geothermal fracture reservoir. Fine structures Flow paths

E N D
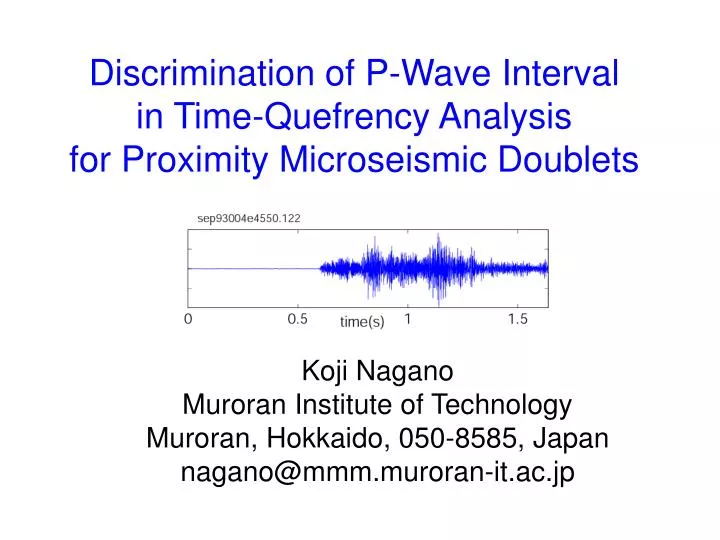
Discrimination of P-Wave Interval in Time-Quefrency Analysis for Proximity Microseismic Doublets Koji Nagano Muroran Institute of Technology Muroran, Hokkaido, 050-8585, Japan nagano@mmm.muroran-it.ac.jp
What we want to know Geothermal fracture reservoir Fine structures Flow paths in geothermal reservoir Cloud Soultz in France
Proximity microseismic doublets Similar waveforms Interval between events is short, <1s.
Accurate location in proximity MS doublets proximity microseismic doublets More precise than doublets with long interval microseismic doublets with long interval different velocity model long interval 1st event 2nd event
Relative location P-wave interval Relative location The relative location estimated based on the interval is much precise than that calculated from the each sources. Fine structure of fracture reservoir
Cepstrum analysis for proximity MS doublets Cepstrum analysis is used to detect interval
Cepstrum Interval
Two cepstrum peaks Which is the P-wave interval in the two cepstrum peaks ? P S P ? S ?
Time-quefrency analysis - Window function suppresses data after the onset of the 2nd S-wave. - I shorten the window function. - When the window function suppresses the 2nd S-wave, S-waves lose similarity and the S-wave peak decreases. cepstrum quefrency Terminal of window • Cepstrum-quefrency graph is used to detect the interval. cepstrum quefrency
Contour plot and cepstrum graph Contour plot: To discriminate the P-wave peak from the S-wave peak identification of the cepstrum peaks - continuity of the peak, - comparison of the peak width - exclusion of artifacts - low resolution in quefrency quefrency Terminal of window Cepstrum graph: - precise detection of quefrency - difficult discrimination from artifacts cepstrum quefrency
4 check points in contour plot P-wave interval peak • starts more early.The window function suppresses the 2nd S-wave.The 1st and 2nd P-waves are isolated. • is more stable.The S-wave peak decreases because the S-wave loses similarity • is lower.The P-wave is smaller than the S-wave • is narrower. S P quefrency cepstrum Terminal of window
Soultz geothermal field 15089 MS events were located during hydraulic injection in 1993. The data were monitored at 4 stations Data length was 1.6 s. Sampling frequency was 5000 Hz. Proximity MS doublets were 230
Typical result of the time-quefrency analysis Early start Stable, low, and narrow peak quefrency Some artifacts are visible Terminal of window cepstrum quefrency
9 events show P-wave interval peak The P-wave interval should be detected at 4 stations to determine relative location. quefrency quefrency Terminal of window Terminal of window quefrency quefrency Terminal of window Terminal of window
Relative location The P-wave intervals in the Proximity MS doublets are compared among the 4 stations. Moriya 2003 showed 4752 relative locations of MS doublets with long interval. We will examine my relative locations and his data.
Conclusions Proximity MS doublets are a good tool to estimate fine structures of a geothermal reservoir. Time-quefrency analysis can provide the P-wave interval between the proximity MS doublets. 4 check points are indicated to discriminate the P-wave interval in a contour plot of the time-quefrency analysis. I have estimated relative locations of 9 events recorded in Soultz geothermal field.
Rotation of coordinates 3 component seismic detector was used. 3D particle motion associated with seismic waves was measured. Data in the direction of the P-wave polarization is analyzed in the time-quefrency analysis. The data is larger than that in the other directions We have clear P-wave peak in the contour plot when the data in the direction of the P-wave polarization is analyzed in the time-quefrency analysis.
A result of the rotation P-S1-S2 X-Y-Z P-wave polarization is estimated in the data at the onset of the P-wave S1: the maximum variance on S-wave plane S2: P and S1 are perpendicular