Download
1 / 37
370 likes | 380 Vues
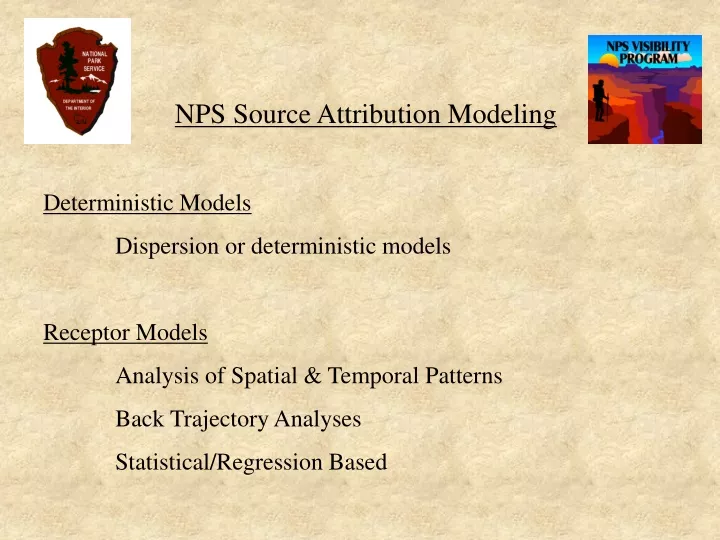
NPS Source Attribution Modeling Deterministic Models Dispersion or deterministic models Receptor Models Analysis of Spatial & Temporal Patterns Back Trajectory Analyses Statistical/Regression Based. “Deterministic” or “Source-based” Models.

E N D
NPS Source Attribution Modeling Deterministic Models Dispersion or deterministic models Receptor Models Analysis of Spatial & Temporal Patterns Back Trajectory Analyses Statistical/Regression Based
“Deterministic” or “Source-based” Models Predictions of concentrations and source attributions at a receptor of interest Meteorology Model(s) Emissions Chemistry Problems: • Lack of input data • Expense
Receptor Models Measured Data at and/or near a receptor Qualitative and/or Quantitative Source Attribution Simple Statistical Analysis Sometimes Meteorology and/or Source Characterization Problems: • Assumptions of linear relationships • Average results only.
Regression Techniques of Source Apportionment Assumption: The concentration measured at the receptor is some linear combination of the contributions of several sources Concentration = a1 Source1 + a2 Source2 + … Variations: CMB (Chemical Mass Balance) Use source profiles and concentrations of several species to predict attributions for 1 measurement period. TMBR (Tracer Mass Balance Regression) Use measurements of tracer concentrations over time to predict an average attribution of 1 traced source. TrMB ( Trajectory Mass Balance) Use many concentrations of 1 species and counts of trajectory endpoints in source regions to predict average attributions over a long period. Others...
Chemical Mass Balance (CMB) Model All equations are for data at a single measurement period. “Source” refers to a “source profile” (ratios of species emitted to total mass emitted). CAs = a1 Source1,As + a2,As Source2,As + …an Sourcen,As CSe = a1 Source1,Se + a2 Source2,Se + …an Sourcen,Se . . . Cspecies m = a1 Source1,m + a2 Source2,m + …an Sourcen,m Solutions for a1…an are found by solving the set of linear equations by regression or other means. Result is fractional amount of each species attributed to each source profile for the single measurement period.
Secondary Particulates & CMB • Assumption of CMB: Sources are linearly related to concentrations. • Solutions for secondary particles • Obtain attributions for the primary fraction only • Use secondary source profiles, i.e. AMSO4=1 • Adjust the source profiles based on other known factors such as meteorology and simple chemistry.
CMB, PMF, and UNMIX Similar models with a few differences… • Source Profiles – In CMB, user determines number and characterization of sources. PMF and UNMIX calculate them for you. UNMIX has upper limit of 7. • Solution Techniques – UNMIX uses factor analysis (SVD). CMB and PMF use weighted regressions. • Cost – PMF $400-700, CMB and UNMIX are free, though UNMIX currently requires MATLAB. • Averaging Time of Solution – CMB is per observation time, PMF and UNMIX are averages over all times. • Uncertainties – Explicitly included for each obs in PMF and CMB, not in UNMIX.
Analyses of Spatial and Temporal Patterns in Measured Concentrations or Other Variables
Empirical Orthogonal Functions (EOFs) A method of finding common spatial & temporal patterns in the data. What is it? Simplifies many patterns into a few that explain most of the variance in the data. Why do it? EOF patterns often qualitatively reveal influential source areas. Using certain assumptions, quantitative average apportionment can be made to these source areas (SAFER Model). When is it used? Often in special studies. Occassionally for routine monitoring data.
Empirical Orthogonal Functions Location Time Array of measured concentrations Express this array as a product of two arrays. EOF Location Location Time EOF Time = X Spatial Patterns Time factors Original Matrix
Factor Analysis What species vary similarly? Do they suggest source types? Example from Big Bend 1996 Scoping Study Factor 1 - 38% of variance S, Se, Na (TX, marine, industry) Factor 2 - 37% of variance Soil elements, Zn, Pb, SO2 (Power plant, smelter) Factor 3 - 13% of variance V, Ni & OC, K (Oil & fires) Factor 4 - 12% of variance As, Cu (smelter)
Trajectory Analysis Methods • Residence Time Type Analyses • Residence Time • Conditional Probability • Source Contribution Function • Average and Maximum Fields • Trajectory Apportionment Model • Quadrant Assignment • Cluster Analysis • Hit - No Hit • Emissions Estimation
Big Bend National Park July 9-11, 1983 Simple Graphical Back Trajectory Analysis Big Bend National Park Nov. 19-22, 1983
Conditional Probability... If an air mass arrived from a given area, what is the probability that the concentration met a given condition?
Average and Maximum Fields Examples for sulfur at Big Bend National Park, 1983 - 1998
Apportionment to Quadrants For a day assigned to a quadrant, 100% of the measured concentration is apportioned to that quadrant.
Five Transport Patterns 1996 Scoping Study, Big Bend National Park
Boxplots of Concentrations by Transport Patterns Based on Clustered Trajectories 1996 Scoping Study - Big Bend National Park
Trajectory Hit or No-Hit Analysis Example from 1991 PREVENT Study, Mt. Rainier National Park, Washington
Trajectory Mass Balance C = concentration Q = emission rate T = transformation/deposition factor to account for deposition, diffusion, and chemical conversion N = trajectory endpoints E = entrainment factor to account for coupling between the transport layer and layer in which pollutant is emitted Subscripts: i = species j = source t = time
Percent of sulfur apportioned to each source area by trajectory mass balance, 1989 - 1991
Percent of organics apportioned to each source area by trajectory mass balance, 1989 - 1991.
Going Backwards…Estimation of Source Strength from Concentrations
Receptor Models in Our Past… Peer-reviewed literature Regulatory decisions Education & Exhibits Interpretation of Data “Reality” checks on models Etc……
Receptor Models in the Future Here’s what we’re working on right now… Evaluation of wind fields & trajectory models Better Data Visualization More sophisticated statistical models User-friendliness Keeping current with hardware, software, internet Integration & reconciliation of models