Download
1 / 36
370 likes | 383 Vues
Nanofluidic Characterization. David Sharp David West Justin Davis. Project Background Customer Needs Specifications Scheduling Concept selection Final Considerations. Agenda. Thin material with billions of microscopic pores Sought out for controlling separation of fluids

E N D
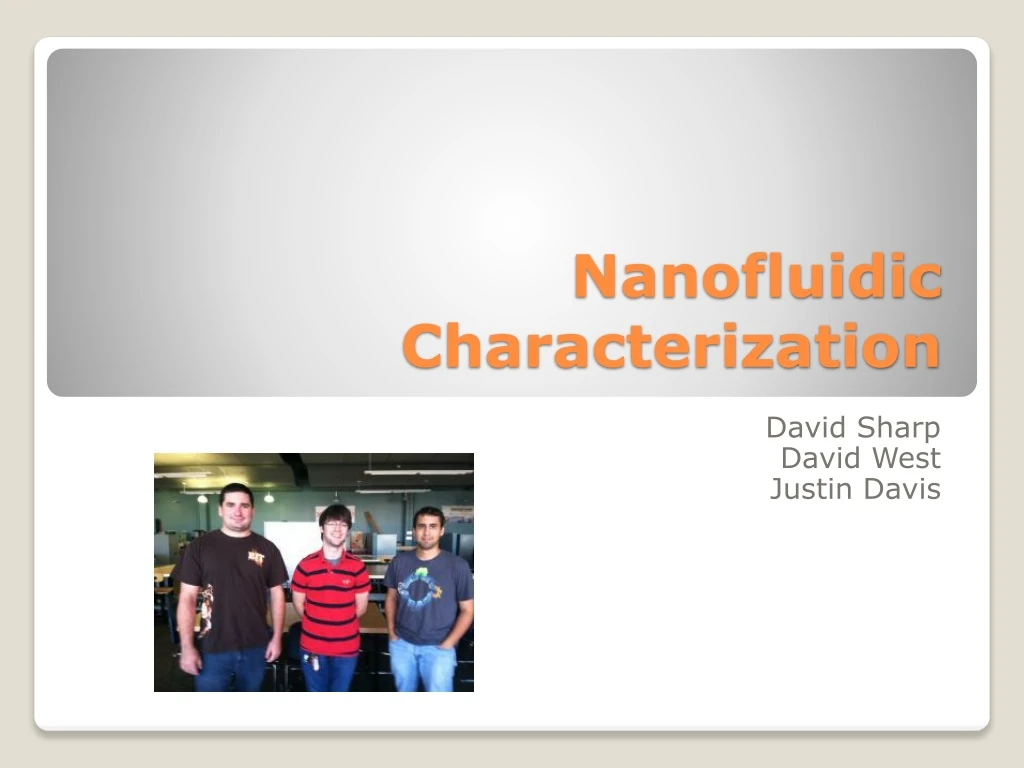
Nanofluidic Characterization David Sharp David West Justin Davis
Project Background • Customer Needs • Specifications • Scheduling • Concept selection • Final Considerations Agenda
Thin material with billions of microscopic pores • Sought out for controlling separation of fluids • Most commonly used for drug delivery and water filtration What is a Nano Porus Membrane?
Characterize the flow rates through nonporous membranes • No current ways to accurately tell what the true flow rates will be • Data will be used to help the customer accurately predict the correct flow rate for each membrane • These membranes will be used as a template to build carbon nano tubes (CNT) and then be used for applications such as cell physiology study. Project Background
Construct the optimal method to test nano-porous membranes through either constructed or purchased materials. • Measuring Characteristics of Flow: • Flow rate • Temperature • Pressure • Visualize Membrane during testing procedure • Edit and Visualize any Data Collected The Goal
David Sharp (Team Leader) – Delegates tasks and maintains work flow • David West (Designer) – Conceives concepts and concept selection. • Justin Davis (Organizer) – Organizes schedule and keeps records of all working documents • Most functions will overlap due to the size of the group and nature of the project Team Members and Roles
Measuring the pressure, temperature, and flow rate • Easy to setup • System must have a frame • Capability to bleed the system to eliminate air bubbles or exchange fluid • Compatible with different membrane sizes • Real time visualization of the data • User selectable flow rate • Visualize membrane • Inject secondary fluid into primary flow stream • Fit under a microscope • Compare Selected Mesurements • Adjustable Sampling rate Customer Needs
Test rig size limit (l x w x h) = 200x120x100 mm • Membrane diameter =13 - 25 mm • Development cost = $2,500 • Pressure range = < 500 kPa • Pressure accuracy = 0.1 Pa • Rate range = 0 - 10 mL/min • Flow rate accuracy = .001 MicroL/min • Temperature range = -20 to 100 deg C • Temperature accuracy = 0.01 deg C • Fine sampling rate = 100 samples per second • Coarse sampling rate = 1 sample per minute Specifications
Laminar Flow through the pipe • Standard Temperature and Pressure • Fully Developed Flow • Steady Flow • Incompressible Flow Calculation Assumptions
Highest customer needs • Measuring of flow rate, pressure, and temperature • User Selectable flow rate • Software/Storing and editing Data • Lower customer needs • Acquiring selected measurements • Fit under Microscope Pair wise Comparison Analysis
Budget is major contributor for project design • Test rig size will limit sensor sizes, however will not include pump • Any need including data selection or constraint input scores high • Note: A high score is due to the parameter being affected by a number of constraints Pareto Analysis
Flow Meter • Temperature Sensor • Pressure Sensor • Pump • Piping • Membrane Holder • Membranes (13mm) • Computer Interface Program Main Components
LabView’s visual interface makes it ideal for observing data during experimentation • Ease to control sensors and other instruments • Data can then be either exported from LabView for further analysis • Although MatLab is a powerful program, LabView’s user friendly interface makes it the better choice Computer Interface
Part Considerations For Final Product (Budget) Total Cost = $2458.83
Part Considerations For Final Product (Over Budget) Total Cost = $3578.83
Team members will arrive to each team meetings on time. • Each meeting will be mage on a weekly basis. • If a team member can not attend a team meeting, they must inform the other team members before the meeting time. • Each task assigned must be evenly distributed within the group. • Team members assigned work must complete that tasks by a discussed due date. • A team member who can not complete the task promptly, or needs assistance finishing that task must then inform the other members of the group to discus either an alternative or work together to get the task completed. Team Ethics
Key Considerations Moving forward • Keeping under budget • Keeping within specifications • Accuracy • What Lies Next • Exact calculations for chosen flow system • Computerized detailed schematics of system Final Considerations