Download
1 / 45
450 likes | 551 Vues
Modeling flow and transport in nanofluidic devices. Brian Storey (Olin College) Collaborators: Jess Sustarich (Graduate student, UCSB) Sumita Pennathur (UCSB). First…. the 30,000 foot view. Microfluidics – Lab on a chip ca. 1990.

E N D
Modeling flow and transport in nanofluidic devices Brian Storey (Olin College) Collaborators: Jess Sustarich (Graduate student, UCSB) Sumita Pennathur (UCSB)
Microfluidics – Lab on a chip ca. 1990 • Microfluidics deals with the behavior, precise control and manipulation of fluids that are geometrically constrained to a small, typically sub-millimeter, scale. (Wikipedia) Micronit Stephen Quake, Stanford Thorsen et al, Science, 2002
Dolomite Dolomite Prakash& Gershenfeld, Science, 2007 Agresti et al, PNAS 2010 Seth Fraden, Brandeis
Circulating tumor cells, MGH Neutrophil Genomics, MGH Kotz et al, Nature Med. 2010 Nagrath et al, Nature 2007 CD4 cell count, Daktari Diagnostics H1N1 Detection, Klapperich BU
“Hype cycle” Microfluidics? Nanofluidics? Gartner Inc.
Nanofluidics • Nanofluidics is the study of the behavior, manipulation, and control of fluids that are confined to structures of nanometer (typically 1-100 nm) characteristic dimensions. Fluids confined in these structures exhibit physical behaviors not observed in larger structures, such as those of micrometer dimensions and above, because the characteristic physical scaling lengths of the fluid, (e.g.Debye length, hydrodynamic radius) very closely coincide with the dimensions of the nanostructure itself. (Wikipedia)
Nanofluidics is interesting because… • Faster, cheaper, better– analogy to microelectronics. • “the study of nanofluidics may ultimately become more a branch of surface science than an extension of microfluidics.” George Whitesides
Pressure driven flow is difficult at the nanoscale Pressure driven flow of a Newtonian fluid between parallel plates has a parabolic velocity profile. The fluid velocity is zero at the walls and is maximum along the centerline. H Low pressure High pressure About 100 atmospheres of pressure needed to drive reasonable flow in typical channels
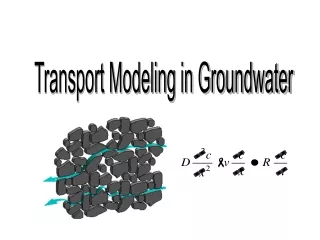
The electric double layer Salt water Glass - + + - + + - + - + + - Glass + water + - + + + - + - - - - + + + + - + - + + - - + + + - + - - Debye length is the scale where concentrations of positive and negative ions are equal. counter-ions co-ions
Electroosmosis(200th anniversary) + - + - - - + + + + + + + + + + + - - + + + - - - + + + + - - - + + + + - - + + + + + + - - + + - - - - + + + + + + + + + + + + - - + + + + + + - - + + + + + - - - + + - - Electric field - - + -
Double layers are typically small ~10 nmVelocity profile in a 10 micron channel Helmholtz-Smolochowski
Pressure-driven Electrokinetic Molho and Santiago, 2002 Electroosmosis-experiments
FASS in microchannels V High cond. fluid High cond. fluid Low cond. fluid σ=1 + σ=10 σ=10 E Electric field σ Electrical conductivity E=10 E=1 Chien & Burgi, A. Chem 1992
FASS in microchannels V High cond. fluid High cond. fluid Low cond. fluid - - - + - σ=1 σ=10 σ=10 - - - - - Sample ion - E Electric field σ Electrical conductivity n Sample concentration E=10 E=1 n=1 Chien & Burgi, A. Chem 1992
FASS in microchannels V High cond. fluid High cond. fluid Low cond. fluid - - - + - σ=1 σ=10 σ=10 - - - - - Sample ion - E Electric field σ Electrical conductivity n Sample concentration E=10 n=10 E=1 n=1 Chien & Burgi, A. Chem 1992
FASS in microchannels V High cond. fluid High cond. fluid Low cond. fluid - - - + - - σ=1 σ=10 σ=10 - - - - Sample ion - E Electric field σ Electrical conductivity n Sample concentration n=10 E=10 E=1 Maximum enhancement in sample concentration is equal to conductivity ratio Chien & Burgi, A. Chem 1992
FASS in microchannels V High cond. fluid High cond. fluid Low cond. fluid - - - - - - - - - - - - - - - - - - - - - - - - - - - - - - - - + - - - - - - - - - - - - - - - - - - - - - - - - - - - - - - - - E dP/dx Chien & Burgi, A. Chem 1992
FASS in microchannels Low conductivity fluid Sample ions Simply calculate mean fluid velocity, and electrophoretic velocity. Diffusion/dispersion limits the peak enhancement.
FASS in nanochannels • Same idea, just a smaller channel. • Differences between micro and nano are quite significant.
Experimental setup 2 Channels: 250 nm x7 microns 1x9 microns
Model • Poisson-Nernst-Planck + Navier-Stokes • Use extreme aspect ratio to get simple equations (strip of standard paper 1/8 inch wide, 40 feet long)
Full formulation 100+ years old Concentration of positive salt ions, Concentration of negative salt ions, Concentration of sample ions, G Navier-Stokes for the fluid velocity vector, Conservation of mass
Analysis procedure • Make dimensionless, with separate scales for channel height, H, and length, L. • Define • Throw out (carefully) terms with any power of in front of them. • Solve the zeroth order problem. • Go back to equations and throw out terms with or higher. • State the first order problem. • Integrate (or average) across the depth of the channel.
Zeroth order electrochemical equilibrium Integrate w/ B.C. Debye length/channel height. Constant ~ 0.1 Relative concentration at centerline, Conc. of positive salt ions = negative Once potential is solved for, concentration of salt ions, conductivity, and charge density are known.
Proceeding to next order in Flow is constant down the channel Current is constant down the channel. Conservation of electrical conductivity. Conservation of sample species. σ is electrical conductivity n is concentration of sample Bar denotes average taken across channel height u is velocity ρ is charge density E is electric field b is mobility (constant)
Assume distinct regions yields jump conditions L2 L1 High cond. Low cond. Region 2 High cond. Region 1 x=0 x=L
Total pressure & voltage drop L1 L2 High cond. Low cond. Region 2 High cond. Region 1 Zeroth order velocity field
Characteristics 1 micron 250 nm Sample ions Low conductivity Sample ions Low conductivity Enhancement =13 Enhancement =125 10:1 Conductivity ratio, 1:10mM concentration
Why is nanoscale different? y/H Low cond. High cond. High cond. y/H High cond. High cond. Low cond. y/H Low cond. High cond. High cond. X (mm)
Focusing of sample ions Uσ Us,high Us,low High cond. buffer High cond. buffer Low cond. buffer Uσ - - Us,high Us,low Debye length/Channel Height
Simple model to experiment Debye length/Channel Height Simple model – 1D, single channel, no PDE, no free parameters
Focusing of conductivity characteristicsfinite interface Low conductivity
Shocks in background concentration Mani, Zangle, and Santiago. Langmuir, 2009
Towards quantitative agreement • Add diffusive effects (solve a 1D PDE) • All four channels and sequence of voltages is critical in setting the initial contents of channel, and time dependent electric field in measurement channel.
Model vs. experiment (16 kV/m) 250 nm 1 micron Model Exp.
Model vs. experiment (32 kV/m) 250 nm 1 micron Model Exp.
Conclusions • Model is very simple, yet predicts all the key trends with no fit parameters. • Future work • What is the upper limit? • Can it be useful? • More detailed model – better quantitative agreement.
Characteristics – 4 channels 1 micron channel 250 nmchannel Red – location of sample Blue – location of low conductivity fluid