Download
1 / 4
40 likes | 146 Vues
SHINE Meeting, July 31 – August 4, 2006 Neutron Monitor Observations of the January 20, 2005 Ground Level Enhancement. John W. Bieber 1 , John Clem 1 , Paul Evenson 1 , Roger Pyle 1 , David Ruffolo 2 , Manit Rujiwarodom 3 , Alejandro Sáiz 2,3 Marc Duldig 4 , John Humble 5

E N D
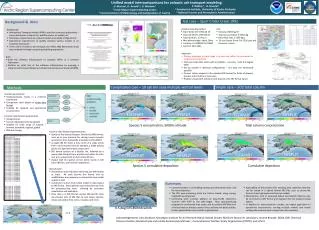
SHINE Meeting, July 31 – August 4, 2006 Neutron Monitor Observations of theJanuary 20, 2005 Ground Level Enhancement John W. Bieber1, John Clem1, Paul Evenson1, Roger Pyle1, David Ruffolo2, Manit Rujiwarodom3, Alejandro Sáiz2,3 Marc Duldig4, John Humble5 (1) Bartol Research Institute and Department of Physics and Astronomy, University of Delaware, Newark, DE 19716, U.S.A. (2) Department of Physics, Faculty of Science, Mahidol University, Bangkok, Thailand. (3) Department of Physics, Faculty of Science, Chulalongkorn University, Bangkok, Thailand. (4) Australian Antarctic Division, Kingston, Tasmania, Australia. (5) School of Mathematics and Physics, University of Tasmania, Hobart, Tasmania, Australia. Presenter: Paul Evenson (penguin@bartol.udel.edu) Supported by NSF grant ATM-0527878, the Thailand Research Fund, and the Rachadapisek Sompoj Fund of Chulalongkorn University. Visit our Website: http://neutronm.bartol.udel.edu/
ENERGY SPECTRASpectra are shown for the GOES peak and decay phase (arrows at right).The neutron monitor extrapolates roughly to the GOES 54 MeV and 110 MeV channels.
TRANSPORT MODELING • No satisfactory fit with single mean free path • Extreme anisotropy and fast decay of initial peak demand a long mean free path • Incompatible with slower decay and smaller anisotropy of second peak. • We solved this dilemma by superposing two separate solutions of the Boltzmann equation, each with its own value of λ and q, and its own injection function. • Optimal fits appear at left. • Earlier injection (dotted) has λ = 0.9 ± 0.1 AU and q ≈ 0.5 • Later injection (dashed) has λ = 0.6 ± 0.1 AU and q ≈ 1.5 • Heavy dark line shows superposition of the two injections. In upper two panels the model is compared with data (histogram) • Interestingly, the superposed injection function displays a typical monotonic rise and monotonic fall. The double peaked structure of the data results from the changed transport parameters, not from a double peaked injection. • Injection function is quite similar to 500 kHz radio burst (red). (Black curve is 5000 kHz.) • Injection onset was 06:41 UT at Sun Wind/WAVES data provided by M.L. Kaiser of NASA/GSFC via the CDAWeb interface
MAPPING RADIATION INTENSITY IN POLAR REGIONS: North Polar Region • Asymptotic viewing directions of the neutron monitor array are determined • Cosmic ray pitch angle distribution (modeled as a constant plus exponential function of pitch angle cosine) is computed in GSE coordinates by least-square fitting • A preliminary computation at each grid point determines if a 1 GV proton is “allowed.” If it is, then that location is considered to have a geomagnetic cutoff below the atmospheric cutoff, and the grid point is included in the map. • The asymptotic viewing direction at the center of the grid point is then computed in GSE coordinates for a median rigidity particle, permitting the “pitch angle” for the location to be determined. • From the model pitch angle distribution, the predicted intensity for that grid point is computed and plotted by color code. Equatorial Region Not Shown South Polar Region