Download
1 / 44
450 likes | 640 Vues
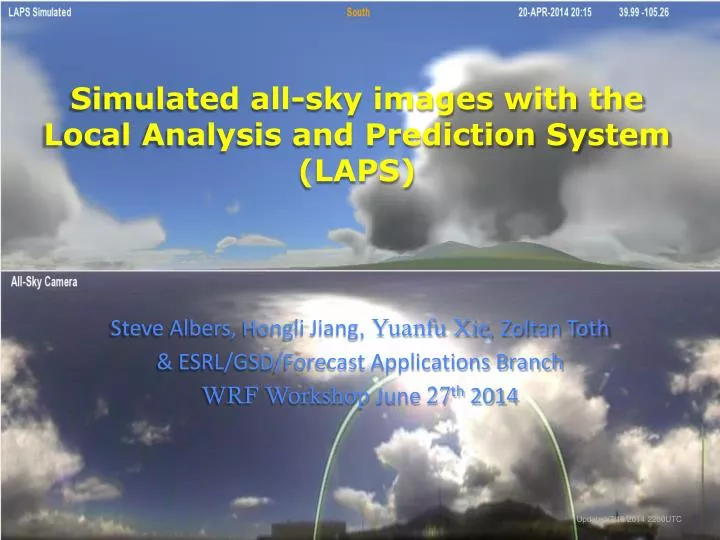
Simulated all-sky images with the Local Analysis and Prediction System (LAPS). Steve Albers, Hongli Jiang , Yuanfu Xie , Zoltan Toth & ESRL/GSD /Forecast Applications Branch WRF Workshop June 2 7 th 201 4. Updated 7 /10/ 2014 2200UTC. All-sky Simulation Purpose.

E N D
Simulated all-sky imageswith the Local Analysis and Prediction System (LAPS) Steve Albers, Hongli Jiang, YuanfuXie,Zoltan Toth &ESRL/GSD/Forecast Applications Branch WRF Workshop June 27th 2014 Updated 7/10/2014 2200UTC
All-sky Simulation Purpose • Helps communicate capabilities of high-resolution real-time LAPS model • Analyses • Forecasts • Display output for scientific and lay audiences • Connect weather phenomena with what can be seen in the sky • Visual display conveys a lot of information • Clouds, Precipitation, Aerosols, Land Surface • Helps guide improvements in cloud, etc. analyses and model initialization • Independent Sensitive Verification • Potential use as a data source for model assimilation 2
All-sky Simulation Ingredients • 3-D LAPSCloud Analyses (or forecasts) • Cloud liquid, ice, rain, snow, graupel • LAPS model developed at ESRL/GSD/FAB • Typical Grid Resolution = 500m • 3-color Surface Albedo (including snow cover) • Locations of Sun, Moon, Planets, Stars • Specification of Aerosols • Optical Depth and Scale Height • 3-D Extinction Coefficient • Specification of Nighttime City Lights • Specify Vantage Point • Latitude, Longitude, Elevation 3
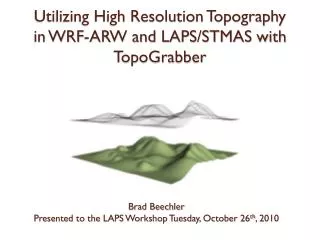
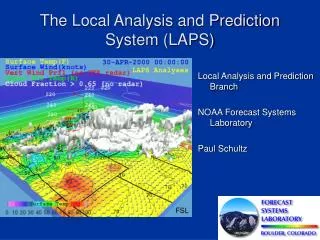
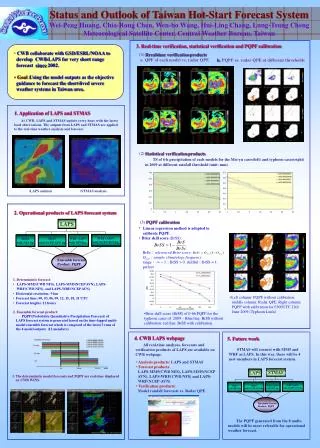
Simulated All-Sky Image Compared with “Moonglow” All-Sky Camera A way to peer into the LAPS analysis (or forecast)
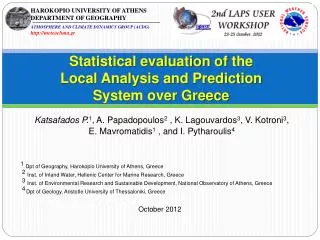
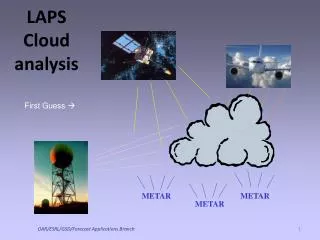
LAPS Cloud analysis First Guess METAR METAR METAR OAR/ESRL/GSD/Forecast Applications Branch 5
Clear sky brightness based on sun, moon, planets, stars • Illumination of clouds, air, and terrain are pre-computed • Ray Tracing from Vantage Point to each sky location • Scattering by Intervening Clouds, Aerosols, Air • Terrain shown where its along the line of sight • Physically and Empirically based for best efficiency Visualization Elements
Two stages of ray-tracing, from sun and from observer • Determine air molecules, hydrometeors, aerosols along ray • Cloud liquid, cloud ice, rain, snow, graupel (as available) • A.k.a. liquid/ice water path (LWP/IWP) • Units can be either kg/m**2 or m (based on water density) • Convert LWP/IWP into optical depth • Use typical values of droplet/crystal size (re) and density for each type of hydrometeor (ρ) • Account for lower density of snow or graupel • τ≈ (1.5 LWP)/(reρ) (Stephens 1978, with ρ term added) Ray-tracing Techniques
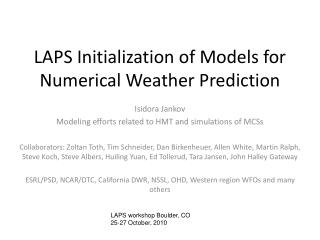
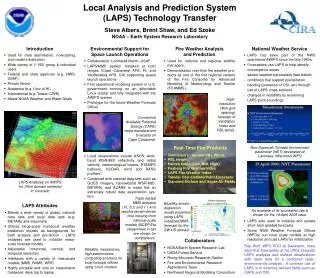
Polar “Fish-eye” lens view Left is LAPS analysis simulation, right is camera image (Moonglow All-sky Camera) Cloud Illumination Example
Compute 3-D short wave radiation field • Calculate fraction of incident sunlight scattered up & down • Based on optical depth and backscattering efficiency • Backscattering efficiency • Ratio of backscatter coefficient to extinction coefficient • .063 for liquid, .14 for cloud ice or snow, 0.3 for graupel • Low values explain why clouds can look opaque yet still darker gray as seen from above • Moon can be light source at night Initial ray-trace from sun through 3-D volume
Trace from viewer into sky at 0.25x0.25 degree grid • Ray path travels through clear air, aerosols, clouds, and may hit terrain • First estimate is clear sky value (background sky) • Scattered by clouds (can show up either bright or dark)depends on optical depth of cloud and elongation from sun, as well as pre-computed cloud illumination (3-D shortwave radiation field) • Phase function varies with single/multiple scattering • Cloud/Aerosol scattering can obscure distant terrain 2nd Ray-Tracing Step (from observer)
Considers entire atmosphere (even above LAPS grid) • Source can be sun or moon • Consider gas + aerosols without clouds • Separate Calculation used as a reference • Rayleigh Scattering by Air Molecules (blue sky) • Minimum brightness 90 degrees from light source • Blue-Green sky color near horizon far from sun • Mie Scattering by Aerosols (haze) • Brighter near the light source (aureole) • Added sky brightness from planets, stars, city lights, airglow “Clear Sky” Brightness Reference
Cloud shadows in clear air can show crepuscular rays • Brightness and color changes shown during twilight • 3-D orientation of Earth’s shadow considered • Secondary scattering needed to reduce contrast in Earth’s shadow that appears opposite the sun Clear SkyIllumination
Overall correction based on optical axis centering, spherical rotation, and radial lens “distortion” Image Navigation • Need to rotate around Lambda Draconis? • Except that near horizon offsets are just in azimuth (zenith rotation)
Cloud Illumination (and scattering) Cloud Illumination Example
Topography data allows showing mountains near the horizon • Terrain Albedo (e.g. a dark forest) • Adjusted by cloud shadows • Show snow cover (future enhancement) • Terrain can be obscured by intervening clouds, haze, or clear air (very long distances) Terrain Illumination
Trace from viewer into sky at ~0.25x0.25degree grid • Ray path travels through clear air, aerosols, clouds, and may hit terrain • First estimate is clear sky value (background sky) • Scattered by clouds (can show up either bright or dark) • depends on optical depth of cloud and elongation from sun, as well as pre-computed cloud illumination • Cloud/Aerosol scattering can obscure distant terrain Main Ray-Tracing Step from Viewer
Calculate fraction of incident sunlight scattered upward • Based on optical depthand backscattering efficiency • Backscattering efficiency • Ratio of backscatter coefficient to extinction coefficient • .063 for liquid, .14 for cloud ice or snow, 0.3 for graupel • Low values explain why clouds can look opaque yet still darker gray as seen from above Scattering of Sunlight by Clouds & Precip
Mie scattering phase function means thin clouds are brighter near the sun (silver lining), cloud corona • Thick clouds are the opposite, being lit up better when opposite the sun • Rayleigh scattering by clear air can redden distant clouds • Future enhancement would be to add rainbows & halos • (with clouds/precip at specific elongation angles) More on Cloud/Precip Scattering
Apply equation to yield cloud albedo (a) using optical depth (τ) and backscatter efficiency (b) • a= τ/ (τ+ 1 / b) • Reproduces figure in Mishchenko et. al. (1996) within a few % (for non-absorbing clouds) • Works with cloud liquid and cloud ice (random fractal crystals) • Reduces to expected relationship: a = τ× b for small values of τ Cloud / Precip Scattering - II
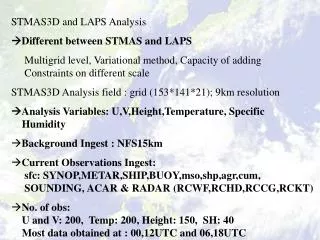
Cylindrical grid (panoramic view) can be calculated as fine as 0.25x0.25 degree spacing • Can show below the horizon (from a mountain top) • future enhancement to show from higher altitudes • Convert to polar grid (shown here) • good for overhead views, and for camera comparison Final Display
Cylindrical Panoramic View (1/4degree resolution)
Internet Demo of All-sky Web page? (optional) http://laps.noaa.gov/allsky/allsky.cgi
Presentation Outline • Principles, methods, and benefits of multi-scale data assimilation for convective-scale applications for situational awareness and the initialization of very fine scale WRF forecasts (Z. Toth) • How to download, build, and run LAPS (S. Albers) • Examples of real-time applications (S. Albers / H. Jiang)
Examples of real-time applications • All-sky camera • Renewable Energy (Solar + Wind) • Convective Initiation and Propagation – Hazardous Weather Testbed (HWT) • Fire Weather & Downscaling • Heavy Precipitation • Winter Weather
3D 1 km CLOUD ANALYSIS - LOOP Unique feature of LAPS, critical for WOF, Nextgen, etc Clouds as seen from top of DSRC building in Boulder by LAPS ANALYSIS ALL-SKY CAMERA 19:00-21:00 UTC Apr 28, 2014, 15-min frequency
Cylindrical Panoramic Analysis Comparison(500m grid - 1/4 angular degree resolution - loop)
WINDSOR, CO TORNADO SIMULATIONgenerated from 3-D cloud analysisCylindrical all-sky image forecast initialized at 1700 UTC 2008 05 221.7 km resolution LAPS, 1-min output frequency, out to 17 minutes SOUTH Loop starts ~45 mins before tornadic winds touched ground. Supercell approaching from South
LAPS/WRF Forecast Animation(1.7km grid - 1/4 degree angular resolution)
3D 1 km CLOUD ANALYSIS LOOP Courtesy Steve Albers Unique feature of LAPS, critical for WOF, Nextgen, etc Clouds as seen from top of DSRC building in Boulder by LAPS ANALYSIS 19:30-21:15 UTC Oct 31, 2013, 15-min frequency ALLSKY CAMERA
Rayleigh Scattering (independent of LAPS grid) • Mie scattering phase function for aerosols • scale height specified ~2000m • Cloud shadows in clear air can show crepuscular rays • Brightness and color changes shown during twilight • 3-D orientation of Earth’s shadow considered • Secondary scattering needed to reduce contrast in Earth’s shadow that appears opposite the sun Clear Air Illumination
3-D field of short wave radiation is computed • Uses 3-D LAPS hydrometeor analyses/forecasts • Efficient simpliedradiativetransfer • Performed in three colors to handle sunrise/sunset Cloud Illumination
Cylindrical Panoramic Analysis Comparison(500m grid - 1/4 degree angular resolution - loop)
What’s next? The sky is the limit!
Simulated All-Sky Images Compared with the DSRC All-Sky Camera by Steve Albers, Vern Raben, and the NOAA LAPS Group