Download
1 / 11
110 likes | 112 Vues
Simulate AMSU-A/B and GOES-10/12 from ECMWF Nature Run and validate simulated data against observations. Includes simulation of GOES10/12 radiance data and AMSU-A/B on NOAA15 and 16.

E N D
Joint OSSE STAR Radiances Simulation Report Tong Zhu, Fuzhong Weng Jack Woollen, Michiko Masutani, Lars Riishojgaard June 2009
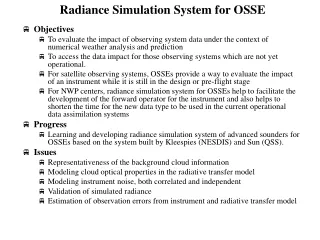
Simulate AMSU-A/B and GOES-10/12 from ECMWF Nature Run • Simulate AMSU-A/B and GOES Sounder data for ECMWF T511 NR Thin data for the time period from May 2, 2005 to May 31, 2006. • AMSU-A on NOAA15 and 16, AMSU-B on NOAA15, 16, and 17, and GOES10 and GOES12 radiance data was simulated. • Validation of the simulated AMSU and GOES data.
Simulation of GOES10/12 • GOES10 and GOES12 radiance data was simulated for the time period from May 2, 2005 to May 31, 2006. The simulated radiances were validated against observations. Figure 3 shows time series of the simulated and observed GOES-12 Sounder mean brightness temperature over Northern Atlantic Coverage for the time period from September 28 to October 10, 2005. It is find that the bias of Tb is below 2 k, and RMS is below 3 K for each band. For those window channels, like band 8 (11.03 µm), RMS is bigger because the surface temperature from ECMWF NR model has big difference as compared with that of observations
OBS vs. NR GOES-12 Sounder RMS and Mean Tb 28 SEP – 10 OCT 2005 Observed vs. simulated GOES-12 sounder for the mean Tb over North Atlantic Ocean region.Black lines are mean Tb from NR simulated, and the red lines are the mean Tb from observation.
Simulation of ABSU-A/B • AMSU-A on NOAA15 and 16, AMSU-B on NOAA15, 16, and 17 radiances were simulated for the same 13 months. Hourly radiance data has been simulated, with the data coverage consistent with the operational GSI data ingest time. Channel correlations have been calculated. More validation study is necessary.