Download
1 / 12
130 likes | 149 Vues
Break-even. Learning Objectives. To explain the purpose of a break-even chart To understand the components of a break-even graph. Key terms. Fixed costs Variable costs Total costs Sales revenue. A business can make a profit …. Fixed Costs. Sales Revenue. Variable Costs. Profit.

E N D
Learning Objectives • To explain the purpose of a break-even chart • To understand the components of a break-even graph
Key terms • Fixed costs • Variable costs • Total costs • Sales revenue
A business can make a profit … Fixed Costs Sales Revenue Variable Costs Profit Total Costs
Or make a loss … Fixed Costs Sales Revenue Variable Costs Loss Total Costs
Break-even Fixed Costs Sales Revenue Variable Costs Total Costs
Breaking even Sales Revenue Costs
Break-even graph The break-even figure help businesses plan how much they need to sell to make a profit. Bill’s Bear Ltd
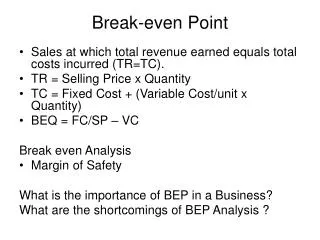
Profit Break-even point Loss Margin of safety
Margin of Safety Margin of safety = Actual/Planned Sales – Sales at break-even point E.g. For Bill’s Bears, if planned sales was 750 Margin of safety = 750 – 420 = 330 bears This means that Bill can sell 330 less bears than planned before being in danger of marking a loss
How to calculate the break-even output Contribution = Selling Price – Variable Cost per unit per unit Breakeven output = Total Fixed Cost Contribution per unit
Scenario – Toy Manufacturer • Total fixed costs of producing toys are £50,000 per year • Variable cost per product sold are £2 • Selling price of the toys is £6 each. Using the calculation method to work out how many toys they must produce to break even.