Download
1 / 20
220 likes | 401 Vues
Break Even Analysis. Learning Objectives. In today’s lesson you will earn about: Re-cap of cost curves What is meant by revenue and how to calculate it What a revenue curve looks like and how to draw it Construction of a break even chart. Costs. Costs. Total costs. Variable costs.

E N D
Learning Objectives • In today’s lesson you will earn about: • Re-cap of cost curves • What is meant by revenue and how to calculate it • What a revenue curve looks like and how to draw it • Construction of a break even chart
Costs Costs Total costs Variable costs Fixed costs output
Total revenue • The value of the goods or services a business sells • Total Revenue = Price (of product) x quantity (sold) • Example - if our previous example sells 10 of its product at £4 its revenue from this sale is; • Total revenue = 10x £4 = £40
Exercise • In our previous example lets assume that the firm we were looking at sells it’s product at £4 • We’ll assume it sells all its output up to 30 units • Ie when it produces 10 units it sells all 10 at £4 so its revenue is £40 • Now draw a new table showing costs, output and revenue • Plot the firm’s revenue curve on a new graph
Revenue Curve Total revenue Costs/price output
Break Even Chart • Now plot all the firms cost curves and revenue curve on one big graph • Use on side of A4 to do this • Use different colours for your lines if possible • You should have something that looks like this:
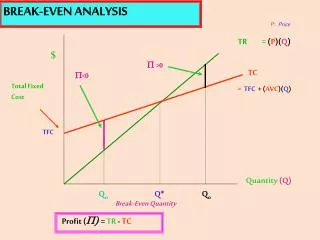
Break Even Chart Profit( margin of safety) Total revenue Costs/prices Break even point Total costs loss Fixed costs output Break even output
Explanation of Break Even Chart • Shows the profit or loss made by the firm at each level of production • The amount of profit is shown as the distance between the total revenue and total cost curves • Where total revenue = total cost is the break even point I.e. neither profit or loss is made • Above the break even point profit is made • Below the break even point losses are made
Exercise • Caroline’s café 2 case study • Tasks 1,2,3,4
Decision making with break even • Shows the effects of changes in costs • Shows the effect of changes in price/revenue
limitations • Assumes all of the product is sold • Unexpected changes in costs can render the chart obsolete
Break Even Formula Break even = Fixed Costs selling price – variable cost/unit
Profit • Profit=Total revenue-total costs • Economists see profit as the reward to entrepreneurs for risk taken in organising the factors of production • Land-rent, labour-wages, capital-interest, enterprise-profit
Exercise • Page 360 It Makes You Think Questions a, b,c,d,e • Page 365 Heinemann textbook integrated activity Questions 1- 4
Fixed Costs Van MOT Javeds Salary New photocopier Andrea’s salary Fax machine Drivers salary Heating Lighting New office carpet Tea bags Variable Costs Petrol Blank paper Electricity for the press Ken’s wages Telephone bill Printing ink Distribution wages Stationary Question 1
Question 2 • Break even = fixed costs/selling price - variable cost/unit • Break even = 100/1.50-1.20 = 333.3 • i.e. 333.3 posters to break even • Ben has accepted the order for 500 posters because he knows he will make a profit on every poster after 334 have been produced
Question 3 • Break even = fixed costs/selling price - variable cost/unit • New break even = 130/1.50-1.20 = 433.3 • Yes Ben should still accept the order of 500 posters as he will make a profit on every poster after 434 have been produced
Question 4 • Break even = fixed costs/selling price - variable cost/unit • (a) BE = 100/1.40-1.20 = 500 posters • (b) BE = 100/1.30-1.20 = 1000 posters • Ben should suggest selling price of £1.40 in order to make a profit ( at £1.30 he will only break even)