Download
1 / 12
270 likes | 826 Vues
BREAK EVEN ANALYSIS. BREAK EVEN ANALYSIS – USES. To analyse level of output/sales needed to make a profit. To measure profit/loss at different levels of output. To analyse sales revenue/total costs at different levels of output. USES - continued.

E N D
BREAK EVEN ANALYSIS – USES • To analyse level of output/sales needed to make a profit. • To measure profit/loss at different levels of output. • To analyse sales revenue/total costs at different levels of output.
USES - continued • To assess changes in production on profitability. • To assess changes of price/costs on profitability. • To aid forecasting and planning. Analysis may be done • graphically in a break even chart • using formulae • in a table
How to draw a break even chart Let’s look at a clip to show how to draw a break even chart.
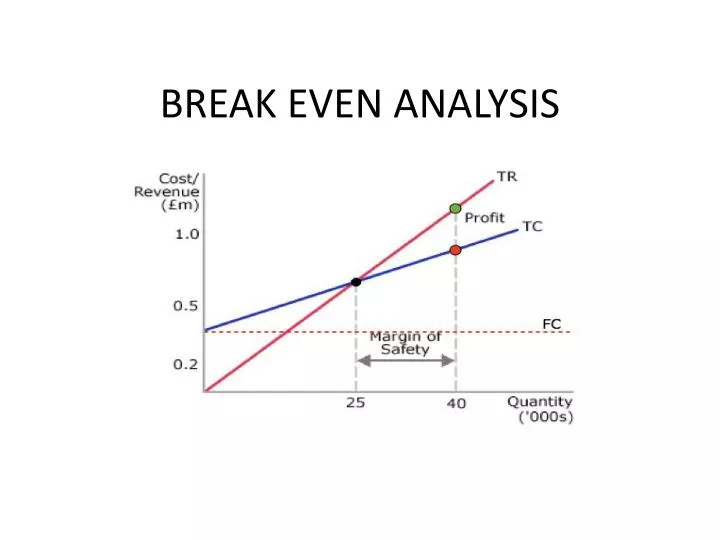
The margin of safety The difference between actual output and the break even output.
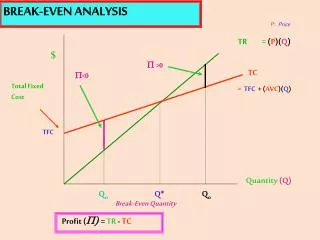
Break Even Point • The point at which total costs are covered and no profit or loss is made. • The point at which the total revenue and total costs lines interest on the chart.
Break Even Formula = fixed costs selling price per unit – variable costs per unit or to put it another way ………… = fixed costs contribution per unit
Break Even Calculation Assuming that a product has a selling price of £6. Variable costs are £1 per unit and fixed costs are £50,000 per year. Calculate the number of units that must be sold for the firm to break even.
Break Even Calculation Assuming that a product has a selling price of £6. Variable costs are £1 per unit and fixed costs are £50,000 per year. Calculate the number of units that must be sold for the firm to break even. Answer £50,000 = 1,000 UNITS £6-£1
STRENGTHS OF BREAK EVEN • Shows different levels of profit coming from various levels of output/sales and so help to predict profit levels. • A quick estimate. • “What if” scenarios. • Calculates level of output required to reach profit (very useful to new businesses, which often have cash flow problems).
LIMITATIONS OF BREAK EVEN • Depends on accuracy of data used. • Based on forecasts. Difficult as actual production costs can change. Why? • Assumes a simple relationship between variable costs and sales (everything stays the same) but in real life: • VC’s do not stay the same. Does not allow for bulk buying discounts. Firms try to reduce VC’s per unit. • SP may change (supply and demand) • FC may not stay the same (new buildings/machinery) • Sales income does not necessarily rise in constant relationship to sales volume (some product may remain unsold)
KEY CONCEPTS • Break even output • Margin of safety • Contribution per unit • Fixed costs • Variable costs • Break even calculation BEP = FC SP-VC