Download
1 / 9
90 likes | 201 Vues
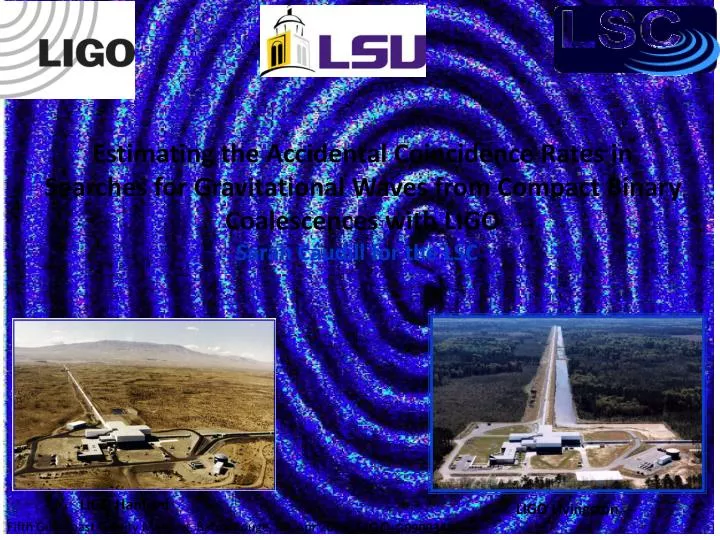
LIGO Hanford. Estimating the Accidental Coincidence Rates in Searches for Gravitational Waves from Compact Binary Coalescences with LIGO. Sarah Caudill for the LSC. LIGO Livingston. Fifth Gulf Coast Gravity Meeting, Baton Rouge, LA, Apr 2009. LIGO- G0900348.

E N D
LIGO Hanford Estimating the Accidental Coincidence Rates in Searches for Gravitational Waves from Compact Binary Coalescences with LIGO Sarah Caudill for the LSC LIGO Livingston Fifth Gulf Coast Gravity Meeting, Baton Rouge, LA, Apr 2009 LIGO-G0900348
The Compact Binary Coalescence Search • Binary Neutron Stars (BNS) • Binary Black Holes (BBH) • Black Hole-Neutron Star Binary (BHNS) Chirp Signal h (strain) time (sec) H1 Data Generate Template Bank Matched Filtering CBC Search Pipeline f (Hz) GW Candidates H2 Data Generate Template Bank Matched Filtering Coincidence Tests; Data Quality time (sec) L1 Data Generate Template Bank Matched Filtering
Statistical Significance The statistical significance of the cbc candidates is estimated from time-shifted triggers Combined SNR ρ Histogram* IFO 1 + Δ t1 IFO 2 + Δ t2 In-time Coincident trigger: potential gravitational wave IFO 1 Δt + Δ t1’=t1+Dt IFO 2 + Δ t2 ρ “Real” data false alarms - SNR Gaussian noise prediction – SNR (width comes from coincidence tolerances) Time-shifted coincident trigger: not a gravitational wave; accidental coincidence “Real” data false alarms – effective SNR ρeff • 100 time slides = 100 independent experiments *LIGO Technical Doc. T070109-01-Z
Utilizing Time-shifted Triggers Histogram of coincident triggers versus statistic 100 Ex: S4 Binary Neutron Star search [Phys. Rev. D 77 (2008) 062002] Total analyzed time = 576 hrs; No detection found Candidates’ distribution Region where outlier candidates would appear 10 Number of events 1 Accidental coincidences distribution 80 90 100 110 120 Combined effective SNR statistic (ρeff)2
Problems with ρeff ranking: Solution: Rank by False Alarm Rate (FAR) Combine double, triple coincidences Plot IFAR = 1/FAR Cum. hist of num. events vs combined ρeff H1H2L1 10 loudest triple coinc. in triple obs. time 1 Number of Events Cum. hist of num. events vs combined IFAR for triple obs. time 0.1 1000 90 50 60 70 80 100 110 120 combined eff snr Number of Events We expect a real GW to lie at high IFAR Cum. hist of num. events vs combined ρeff H1L1 100 1000 10 100 loudest double coinc. in triple obs. time 1 10 Number of Events 10-4 10-3 10-2 10-1 100 1 IFAR (yr) 0.1 80 20 40 60 100 120 160 180 140 combined eff snr plots from s5 1st yr low mass search [arXiv:0901.0302]
Problems with ρeff ranking: Solution: Rank by False Alarm Rate (FAR) Combine double, triple coincidences Plot IFAR = 1/FAR Cum. hist of num. events vs combined ρeff H1H2L1 10 We only do 100 timeshifts. 1 Number of Events Cum. hist of num. events vs combined IFAR for triple obs. time FAR?? 0.1 1000 90 50 60 70 80 100 110 120 + combined eff snr Number of Events Cum. hist of num. events vs combined ρeff H1L1 100 1000 10 100 loudest double coinc. in triple obs. time ? ? 1 10 Number of Events 10-4 10-3 10-2 10-1 100 1 IFAR (yr) 0.1 80 20 40 60 100 120 160 180 140 combined eff snr plots from s5 1st yr low mass search [arXiv:0901.0302]
Better Estimation of Accidental Coincidence Rate Combined Effective SNR H1 Single Detector SNR* Tail of distribution provides valuable info 10 Number of triggers 1 Map to account for coinc. in time and mass Map from single detector ρ dist.’s to single detector ρeff dist.’s Convert to IFAR dist. Cumulative IFAR 110 80 100 90 If the information in the tails of the single detector ρ dist. is not lost due to time-shifts, we can determine the correct accidental coincidence distribution at large IFAR. Combined SNR statistic *S4 Primordial Black Hole Search [Phys. Rev. D 77 (2008) 062002]
Meaningful False Alarm Rates Histogram of coincident triggers versus statistic 100 10 Number of events What we hope to see soon! 1 1 Find meaningful FAR! 80 100 120 Combined effective SNR statistic (ρeff)2 Correct distribution at high SNR!