Download
1 / 75
750 likes | 902 Vues
Creating a Healthier Community with Stickiness _ Healthy Bedford by Design Bedford, MA May 2013. Enjoying a walk on the Narrow Gauge Rail Trail . . . Common challenges to “healthy design:”. Isn’t health a result of personal decisions & habits ?

E N D
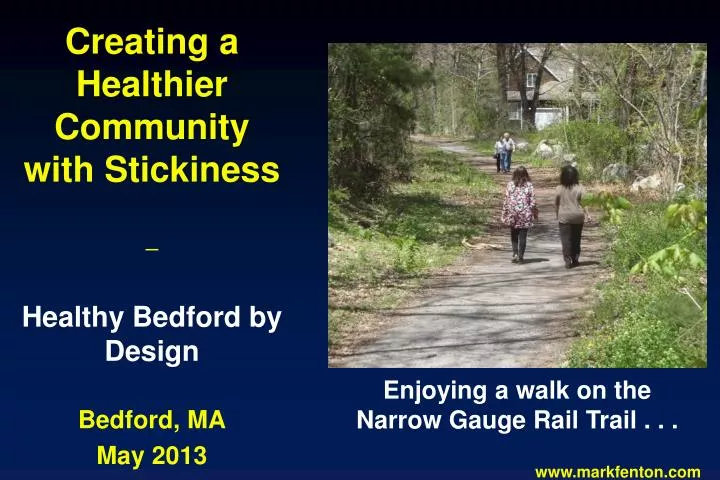
Creating a Healthier Community with Stickiness _ Healthy Bedford by Design Bedford, MA May 2013 Enjoying a walk on the Narrow Gauge Rail Trail . . .
Common challenges to “healthy design:” • Isn’t health a result of personal decisions & habits? • If we build it, will they come? (People are naturally lazy . . .) • Shouldn’t the free market dictate how we build our cities & towns? • So, what is your prescription for healthy design? Could we actually do it here? Sauntering on a Bedford sidewalk.
Not just my idea . . . 30-Nov-2009 The Australian, 14-Oct-2009
Changes in Walking & Cycling to School, 1969 to 2001 Ham et.al., Jour. of Physical Activity & Health, 2008, 5, 205-215 W/B = Walk/Bike
Trends in Childhood Obesity & Overweight CDC, National Center for Health Statistics. National Health Examination & Nutrition Surveys (NHANES). www.rwjf.org/files/publications/annual/2008/year-in-review/
America’s looming chronic disease apocalypse . . . US “Obesity Epidemic”Ogden et. al. (JAMA 288, 14; Oct. 2002)
Diabetes Risk Reduction(Diabetes Prevention Program; NEJM, Feb. 2002)
Step one:Change our thinking.It’s not just an obesity epidemic. It’s twin epidemics of physical inactivity and poor nutrition.* * Two of the three biggest drivers of skyrocketing healthcare costs.
The bad news in just three numbers: minutes of daily physical activity recommended (60 mins. for youth). % of American adults actually meet these recommendation (thru LTPA). ,000 Estimated annual deaths in America due to physical inactivity & poor nutrition. (2nd only to tobacco.) 30 20 365
Surgeon General’s Report 1996 Physical Activity Guidelines 2008 www.health.gov/paguidelines • 150 min/week of moderate physical activity; more is better. • Any activity is better than none. • Can be broken up. • 300 min/week for children. • Reduced risk for CVD, diabetes, osteoporosis, obesity, dementia in old age, clinical depression, a growing list of cancers . . . This counts!
Leisure Time Physical Activity in the US (MMWR: 50(09), 166-9; 54(39), 991-4)
Why is it so resistant to change? I believe in large part the stickiness problem!
Exercise ParticipationEffect of Short Bouts, Home Treadmills(Jakicic et.al., J. Amer. Med. Assoc., 282, 16) ?
Exercise ParticipationEffect of Short Bouts, Home Treadmills(Jakicic et.al., J. Amer. Med. Assoc., 282, 16)
Self-help vs. CommercialWeight Loss Programs (Heshka et.al., J. Amer. Med. Assoc., 289, 14; Apr. 2003)
A realization: Simply telling people to “exercise” is not enough. We need to support increases in routine, daily physical activity for everyone.
A realization: Simply getting people on “diets” is not enough. We need to help provide healthy food that is affordable, accessible, & appealing for everyone.
Social Ecology Model Individual – motivation, skills Determinants of behavior change Sallis & Owen, Physical Activity & Behavioral Medicine. Interpersonal - family, friends, colleagues Institutional - school, work, health care & service providers Community - networks, facilities Public Policy - laws, ordinances, permitting practices & procedures
Individual motivation, skills Easier to Implement Greater Impact Interpersonal - family, friends, colleagues Institutional - school, work, health care & service providers Community - networks, facilities Public Policy - laws, ordinances, permitting practices & procedures
Tobacco – Education, kids, taxes, 2nd hand smoke policies/bans. Seat belts, child safety restraints – Media, training, laws, enforcement. Recycling – Kids, facilities, fees. Water & sewer – Education, ordinance & design requirements, inspection/enforcement procedures. Socio-ecological successes?
Necessary and important, but not enough. > < We must build communities where people are intrinsically more active.
If we build it will they come?(Does the built environment really matter?)
YES! Four elements . . . Variety of uses within walk, bike, & transit distance. Network: sidewalks, trails, bike lanes, transit. Site designs are functional & inviting for pedestrians, bicyclists, & transit users. Safe & accessible for all ages, incomes, abilities www.thecommunityguide.org CDC Guide to Community Preventive Services
Live, work, shop, play, learn, pray. 1. Land use. E.g. post office, grocery, schools Compact neighborhoods & shared open space. Housing above, retail below. Marlborough Berry Park
2. Network is more complete with: • Presence of sidewalks, bike lanes, pathways. • Shorter blocks, cul-de-sac connectors, more intersections. • Access to quality, affordable transit. > Bunker Hill Park
Transit riders are physically active. Besser, Dannenberg, Amer. J. Prev. Med., 29 (4), Nov. 2005. Just during the daily walk/bike to transit: • Half of transit riders walk at least 19 mins. • 29% get at least 30 mins. of activity. • Minorities, poor (income <$15k/yr.), denser urban dwellers more likely to get 30+ mins./day.
Shar-row (shared use arrow) Bicycle network options: Bicycle lanes
3. Site Design: Bridgewater Which setting is more inviting for travel on foot or by bicycle?
Portland, OR Site design?Research & practice suggest: Lexington Buildings near the sidewalk, not set back; parking on street or behind. Trees, benches, lighting, awnings, “human” scale. Details: bike parking, open space, plants, art, materials.
Possible incentives: • Decrease, share parking (include bike racks). • Build-to, not set-back requirements. • Expedite permits. Neenah, WI Elected & appointed officials must be supported if expected to act with vision & courage! Appleton, WI
4. Safety & access. Median islands Engineering can markedly improve safety. Increasing pedestrian and bike trips decreases overall accident & fatality rates. Roundabout (Neenah, WI) Curb extensions (Jacobsen P, Injury Prevention, 2003; 9:205-209.)
Lane re-alignments • Often called road diets, being seen more often. • Can reduce collisions & severity. • Dramatically improves performance for pedestrians & cyclists. Urbana, IL; before & after.
5. Community design & food systems? • Community gardens (schools, parks, senior housing). • Urban agriculture (compost, chickens, bee-keeping, etc.). Regulate fast food, drive-through locations. Farmer’s markets (w/ EBT), healthy corner stores.
Five Elements of Healthy Community Design: Ped, bike, & transit network Mix of destinations Healthy affordable food Safety & access Site design www.activelivingresearch.org
Shouldn’t the free market dictate how we build our cities & towns?
Econ 101: Internalize external costs. • Social: • Equitable transportation. • More personal connections. • Environmental: • Reduced traffic; air, water, & noise pollution. • Education, schools: • Health & safety. • Behavior & performance! • Transportation costs. • Teacher morale. • Community engagement. • Safety: • Kids, elderly mobility. • Crime deterrent.
Economics.Walking the Walk: How Walkability Raises Housing Values in U.S. Cities (CEOs for Cities report)* (off of Dudley Rd.) walkscore = 11 walkscore = 65 Higher score = $4,000-$34,000 home value *www.ceosforcities.org/work/walkingthewalk www.walkscore.com
On Common GroundNat’l Assoc. of Realtors pub.; Summer 2010, www.realtor.org The Next Generation of Home Buyers: • Taste for urban living. • Appetite for public transportation. • Strong green streak. • Plus, Americans are driving less overall!
What’s happening? • 1st & 2nd generation malls & big boxes are struggling. • Employers seek vibrant, livable communities, where employee health, satisfaction, & retention are high! Rosemount Or more simply: Which generates more economic activity, a marginal mall or thriving centers?
The Triple Bottom Line . . . Healthy Economy Planet Healthy Environment Prosperity Healthy People People
Policies: Support six national movements changing the “health” landscape. (Fenton, Community Design & Policies for Free Range Children, Childhood Obesity 8(1), Feb 2012) • Healthy planning & zoning. • Complete Streets. • Transportation trail networks. • Transit- & bicycle-friendly policies. • Comprehensive Safe Routes to School. • Healthy, affordable, accessible food.
1st: Build a compact, focused, interdisciplinary leadership team targeting healthy design: • Education, schools • Planning & Zoning • Engineering, DPW • Parks, Recreation • Public Health & Safety • Historical preservation • Social justice & equity • Chamber of Commerce • Developers, Lenders, Realtors • Neighborhood Assoc., Church & Service Groups • Environment, Conservation Policy information: www.lgc.org www.vtpi.org
The “org” chart: Bike/Ped Advocates YMCA Parks Rec. Planning AHA Trails Health ACS Developers ADA Transport Electeds Hospital Employers PTOs DPW Schools Insurer Neighbor- hoods
The “stealth” chart: Bike/Ped Advocate Trails Elected Rec. Transport Planning Parks Enviro. Vision DPW Econ. Devlpmt Neighbor- hoods NAR Environ. Banks Developer NAHB Chamber Chamber Schools Health Employers PTOs Insurer Hospital Churches Found. ADA Service Orgs. AHA ACS
To be on the stealth leadership team people must: • Be able to spend time on this as part of job responsibilities; not just volunteers. • Have community influence and be able to reach critical partners. • Fully embrace vision of active, healthy community design. A world for free-range kids.
1. Update the Comprehensive Plan . . . • Focus on pedestrian-, bike-, transit-oriented development. • Restore mixed-use village centers.